Dashboards
A Dashboard is a customizable layout of charts. Unlike the Charts view (which plots whatever you select from the metrics tree), a dashboard is a curated set of charts you define and arrange. Dashboards exist at both the project level (across runs) and the run level.
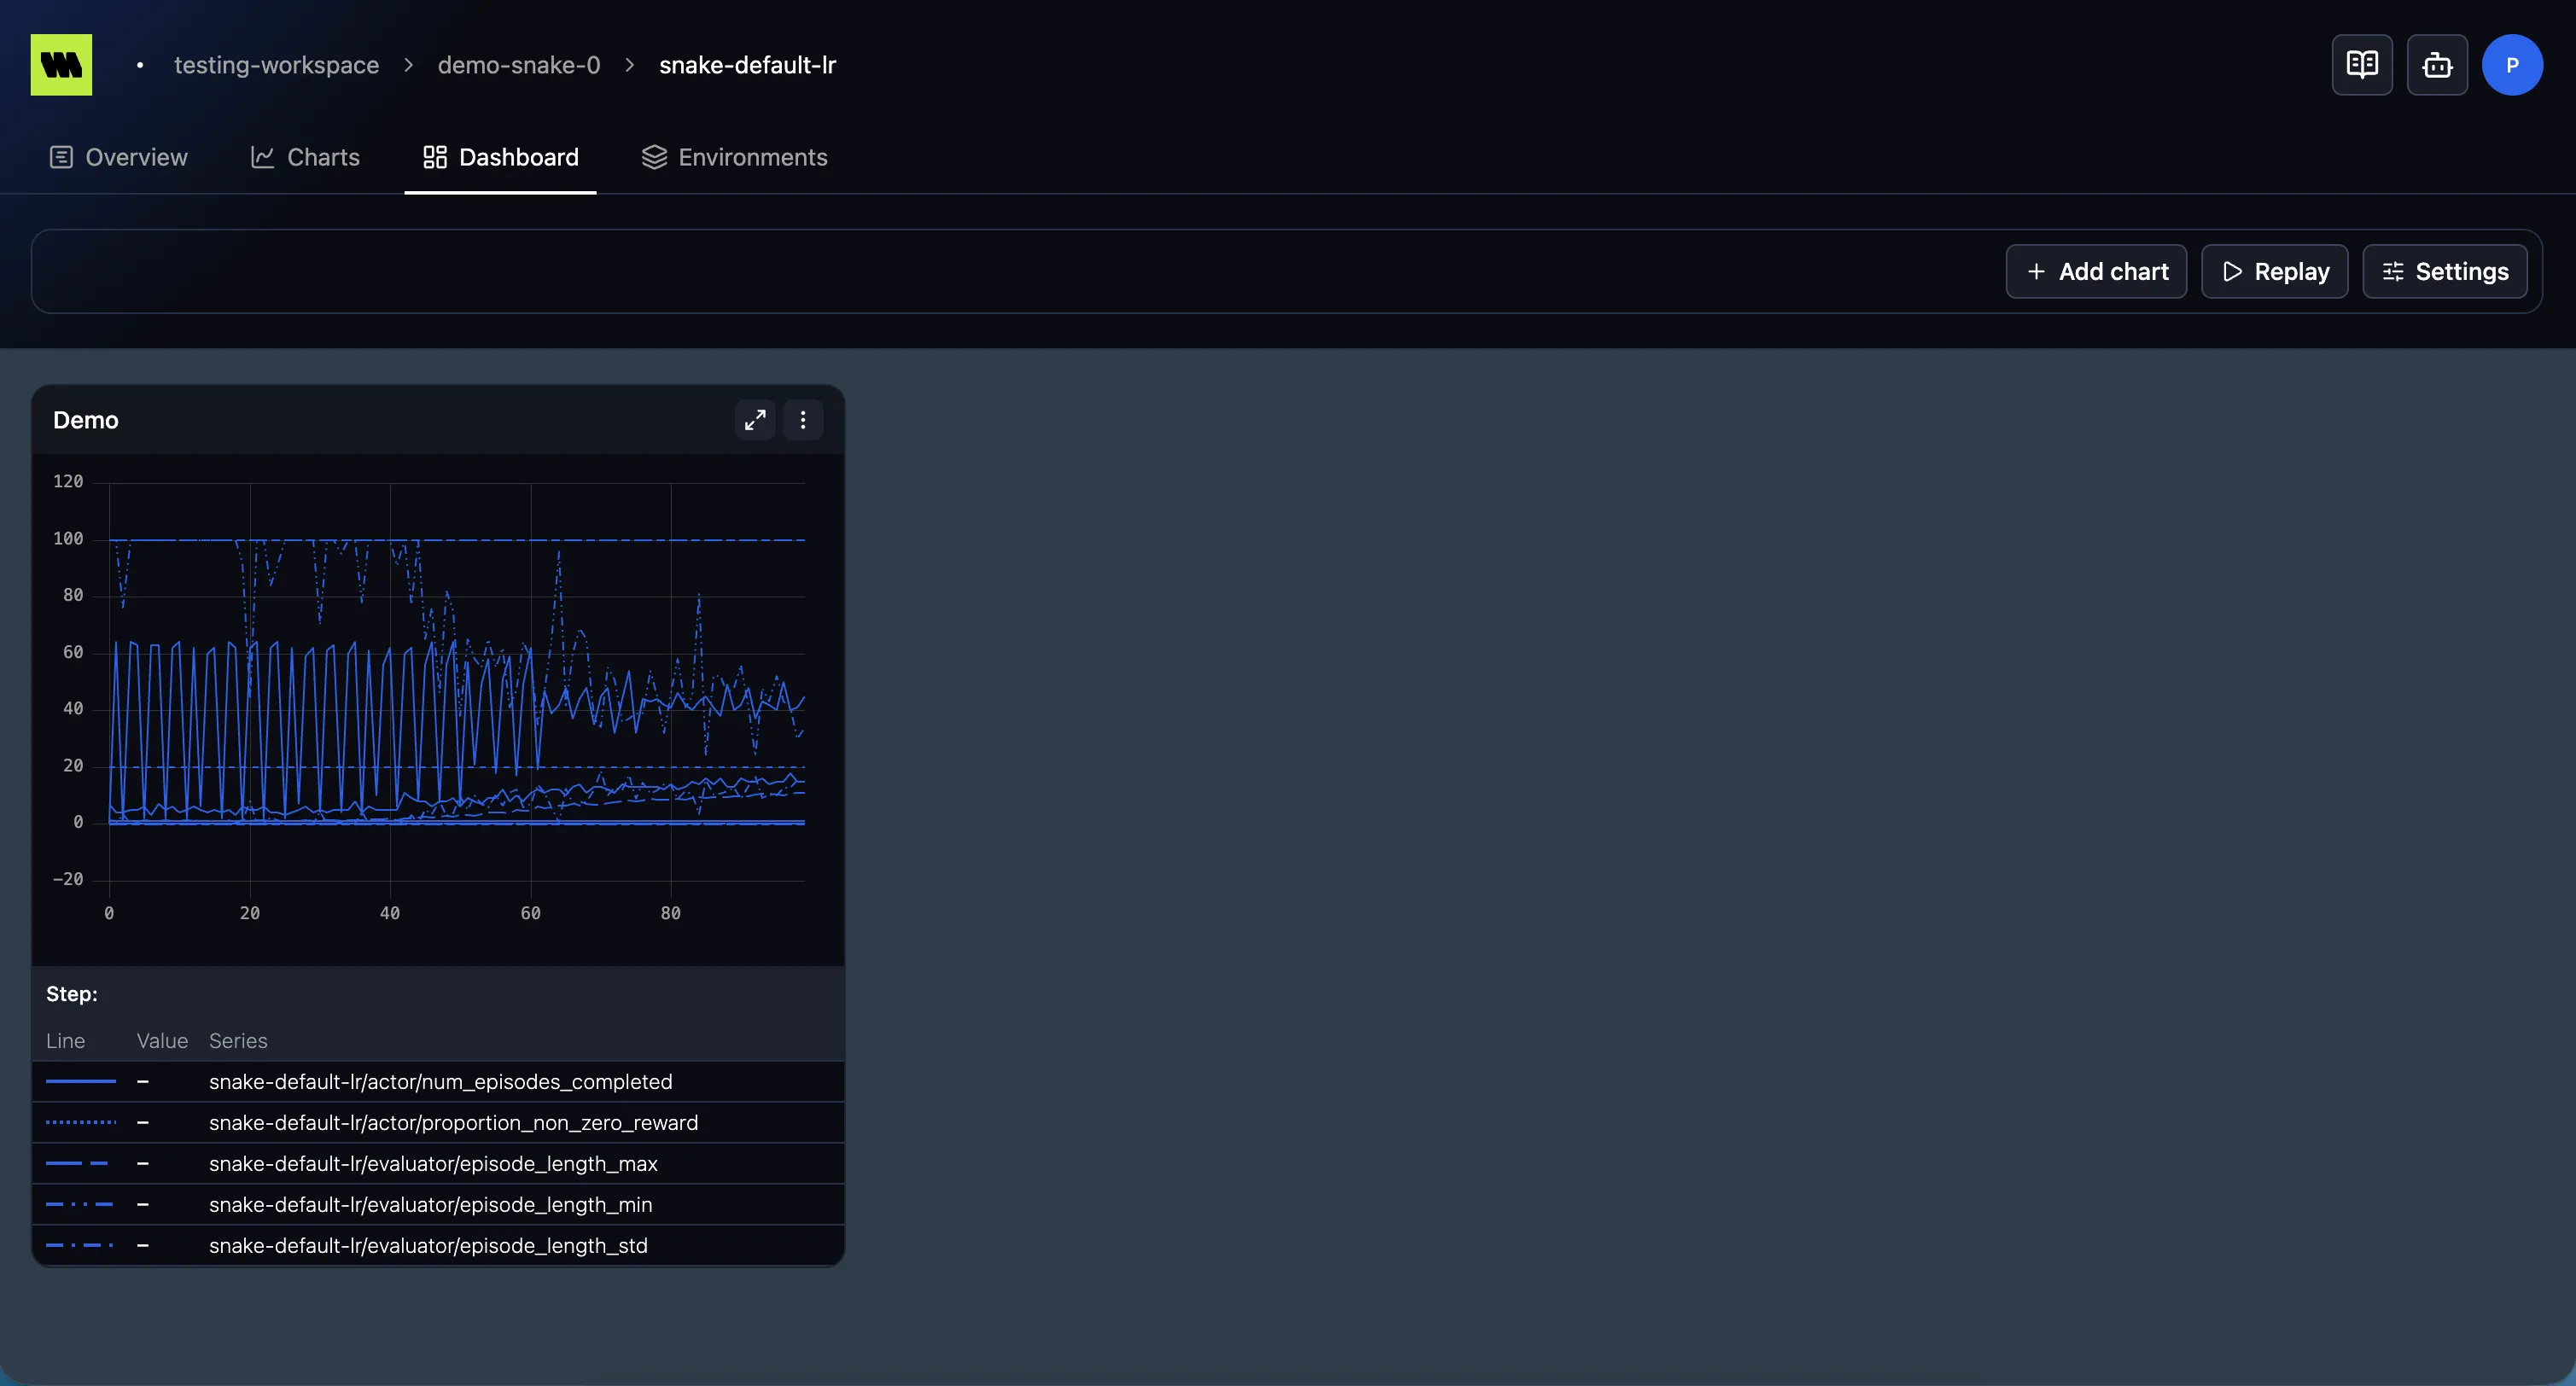
Add a chart
Section titled “Add a chart”Choose Add chart and, in the dialog:
- Give the chart a Title.
- Select one or more Metrics to plot on it.
- Confirm — the chart is added to the dashboard.
A new dashboard starts empty (“No charts yet”) until you add your first chart. To change a chart later, edit it (the dialog becomes Edit chart).
Arrange and configure
Section titled “Arrange and configure”- Settings applies chart settings (scale, smoothing, x-axis) as the dashboard’s page defaults; individual charts can still override them.
- Replay animates the dashboard’s charts over time — see Charts.
Dashboard vs. Charts vs. Compare
Section titled “Dashboard vs. Charts vs. Compare”- Charts — quickly plot any metrics you select for a single run.
- Dashboard — a saved, curated layout of specific charts.
- Compare — overlay the same metrics across multiple runs.