Metrics tree
The metrics tree is the panel for choosing which metrics to plot. It appears on the left of the Charts, Compare, Side-by-side, and environment chart views. All metrics are displayed if no metric is selected.
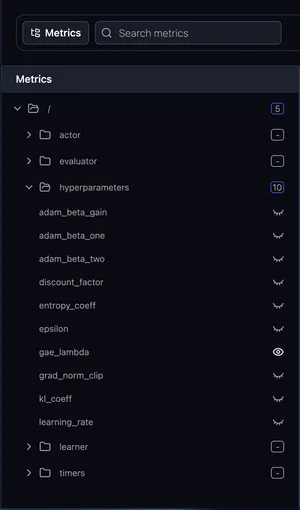
The tree
Section titled “The tree”Metric names are organized hierarchically by their path (the / segments in names like
train/accuracy), so related metrics group into folders.
- Expand / collapse folders to navigate the hierarchy.
- Search to filter the tree to matching metric names. Regular expressions are supported, and the input flags a pattern that isn’t valid regex so a half-typed expression reads as a mistake rather than as “no metrics match”.
- Select all metrics in folder (by clicking the counter indicator) to plot them — each selected metric is shown as a chart.
- Select individual metrics (by clicking the eye indicator) to plot them — each selected metric is shown as a chart.
- Show / hide the tree with the toggle in the toolbar to give the charts more room.
- Resize the panel by dragging its edge to fit longer metric names or reclaim space for the charts.
Large trees load incrementally — scroll to load more, and use Search to jump straight to what you need.