Environment charts
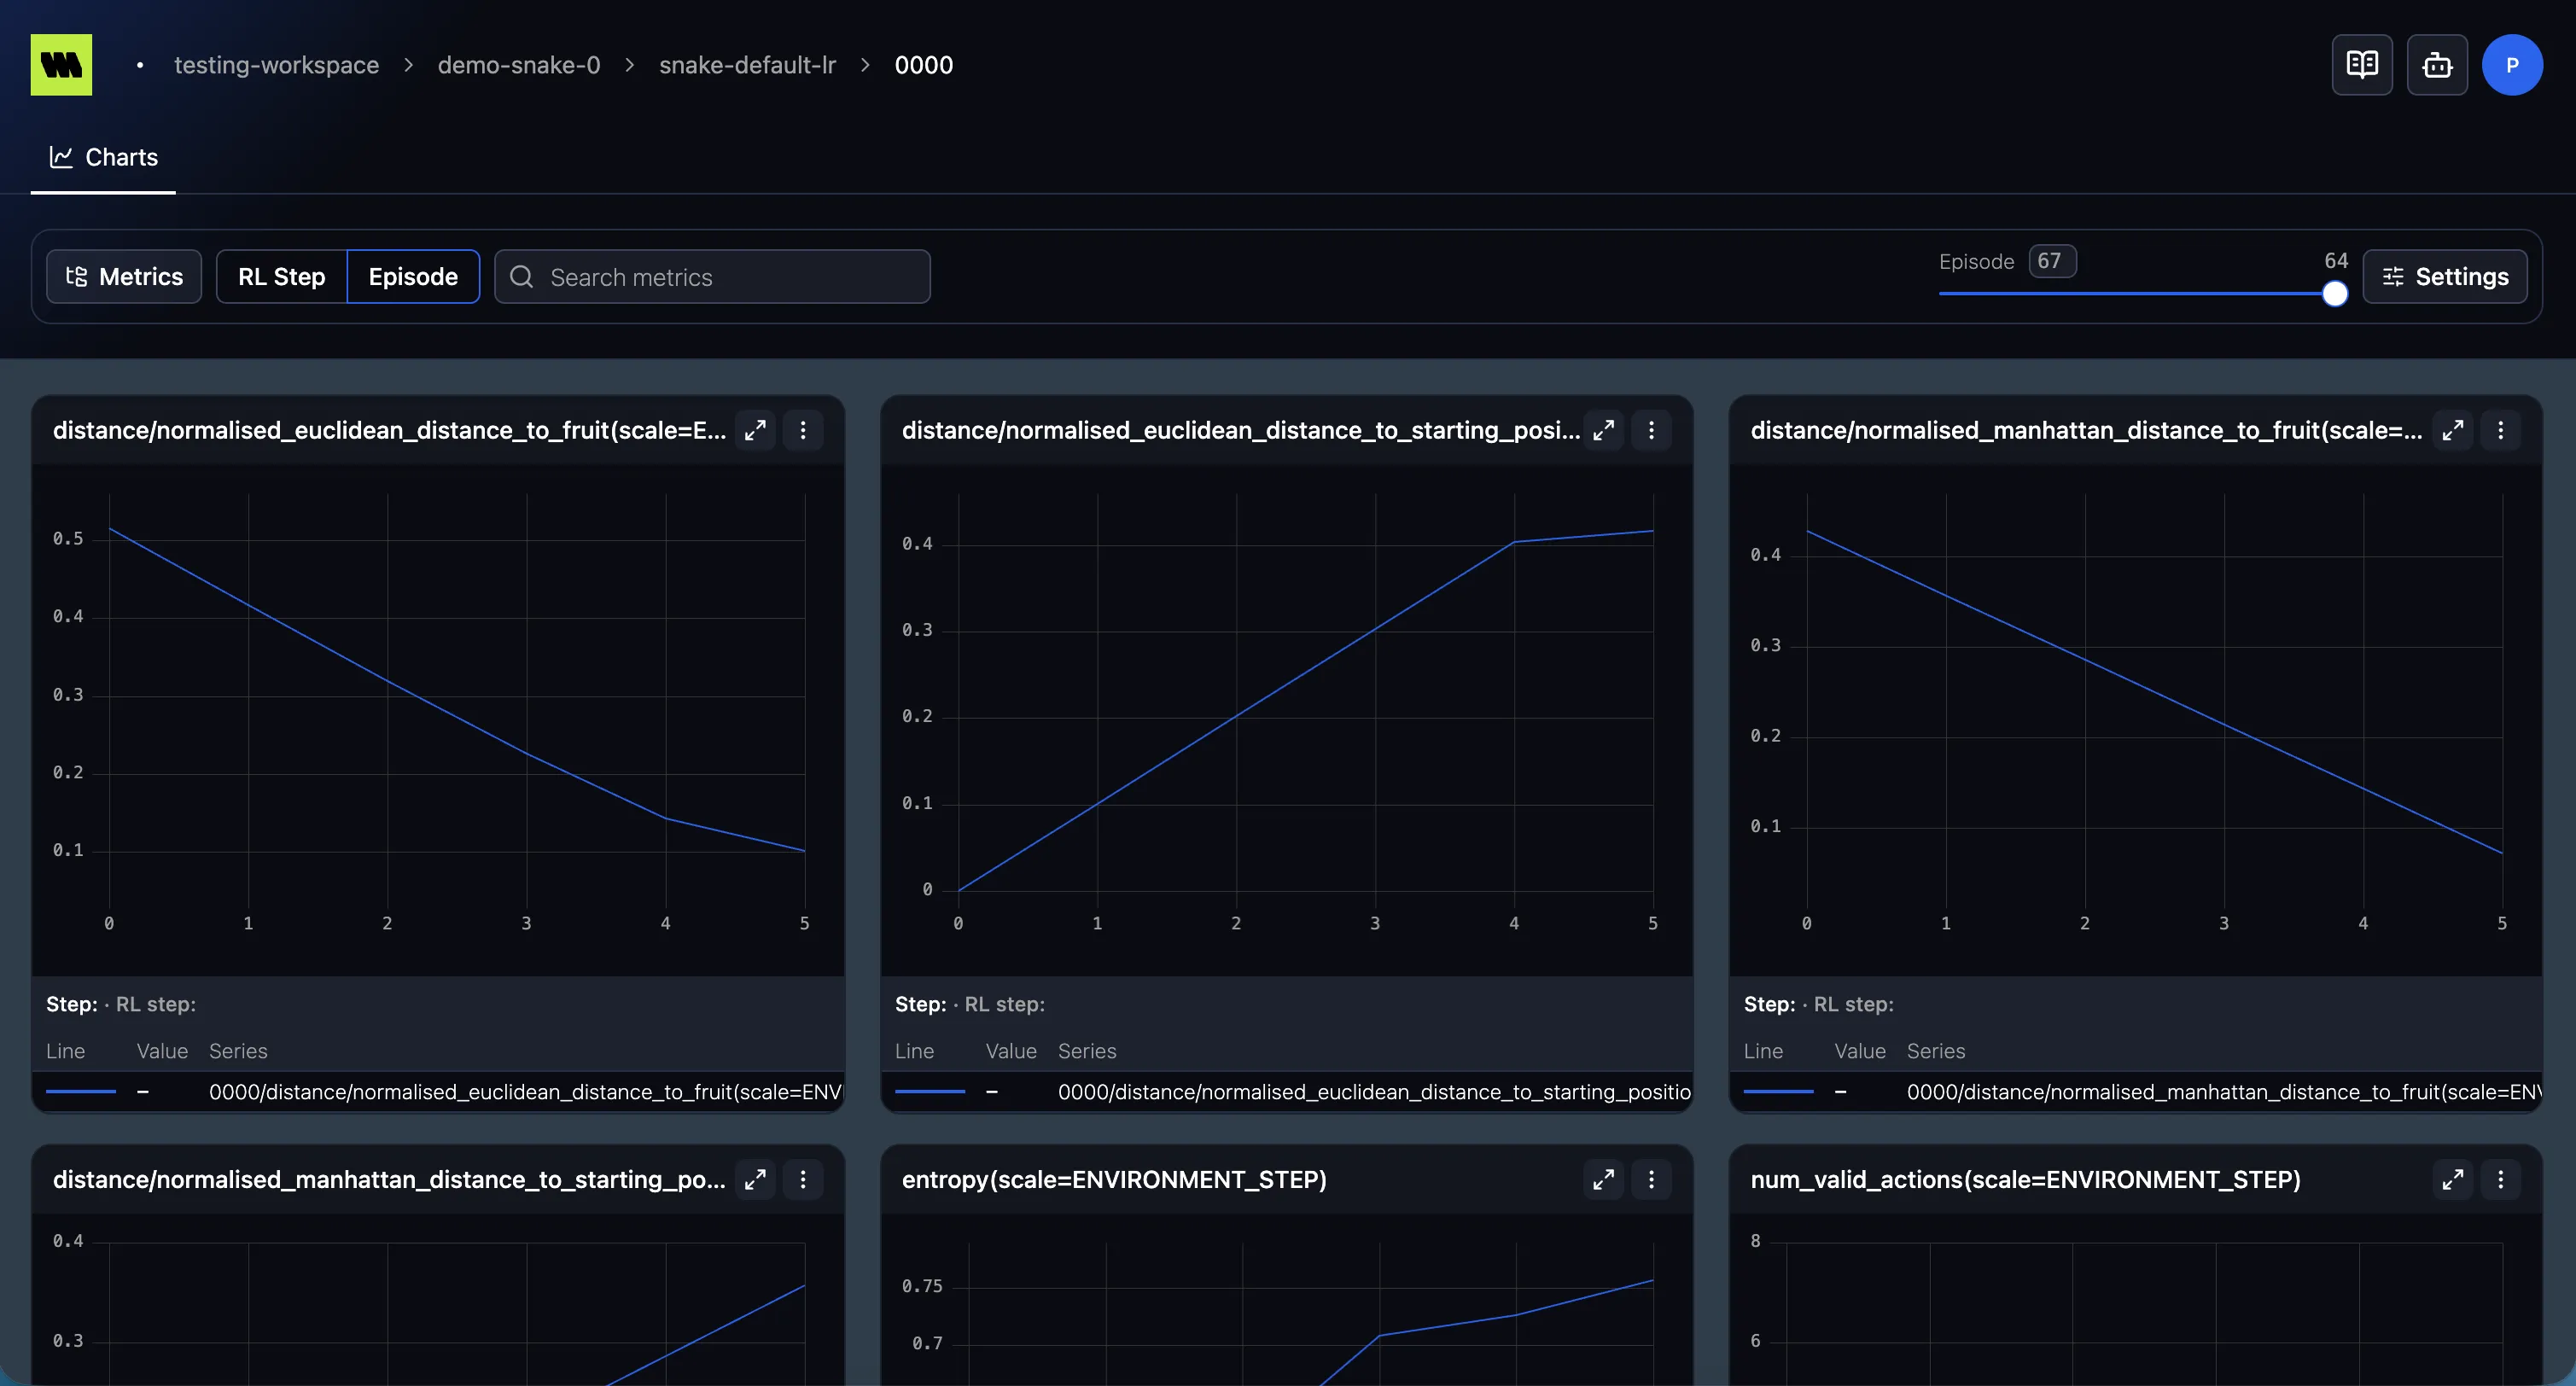
Opening an environment from the Environments table shows its Charts — the metrics logged for that specific environment (its episodes and per-step data).
Selecting metrics
Section titled “Selecting metrics”Use the metrics tree to choose which of the environment’s metrics to plot, exactly as on a run’s Charts view.
Scale controls
Section titled “Scale controls”Like the environments table, environment charts offer the RL Step / Episode toggle and the slider to position in time — see Episodes & steps.