Environments overview
For reinforcement learning runs, the Environments tab lists the environments in the run — each a single instance of the world an agent interacts with, identified by its Environment ID.
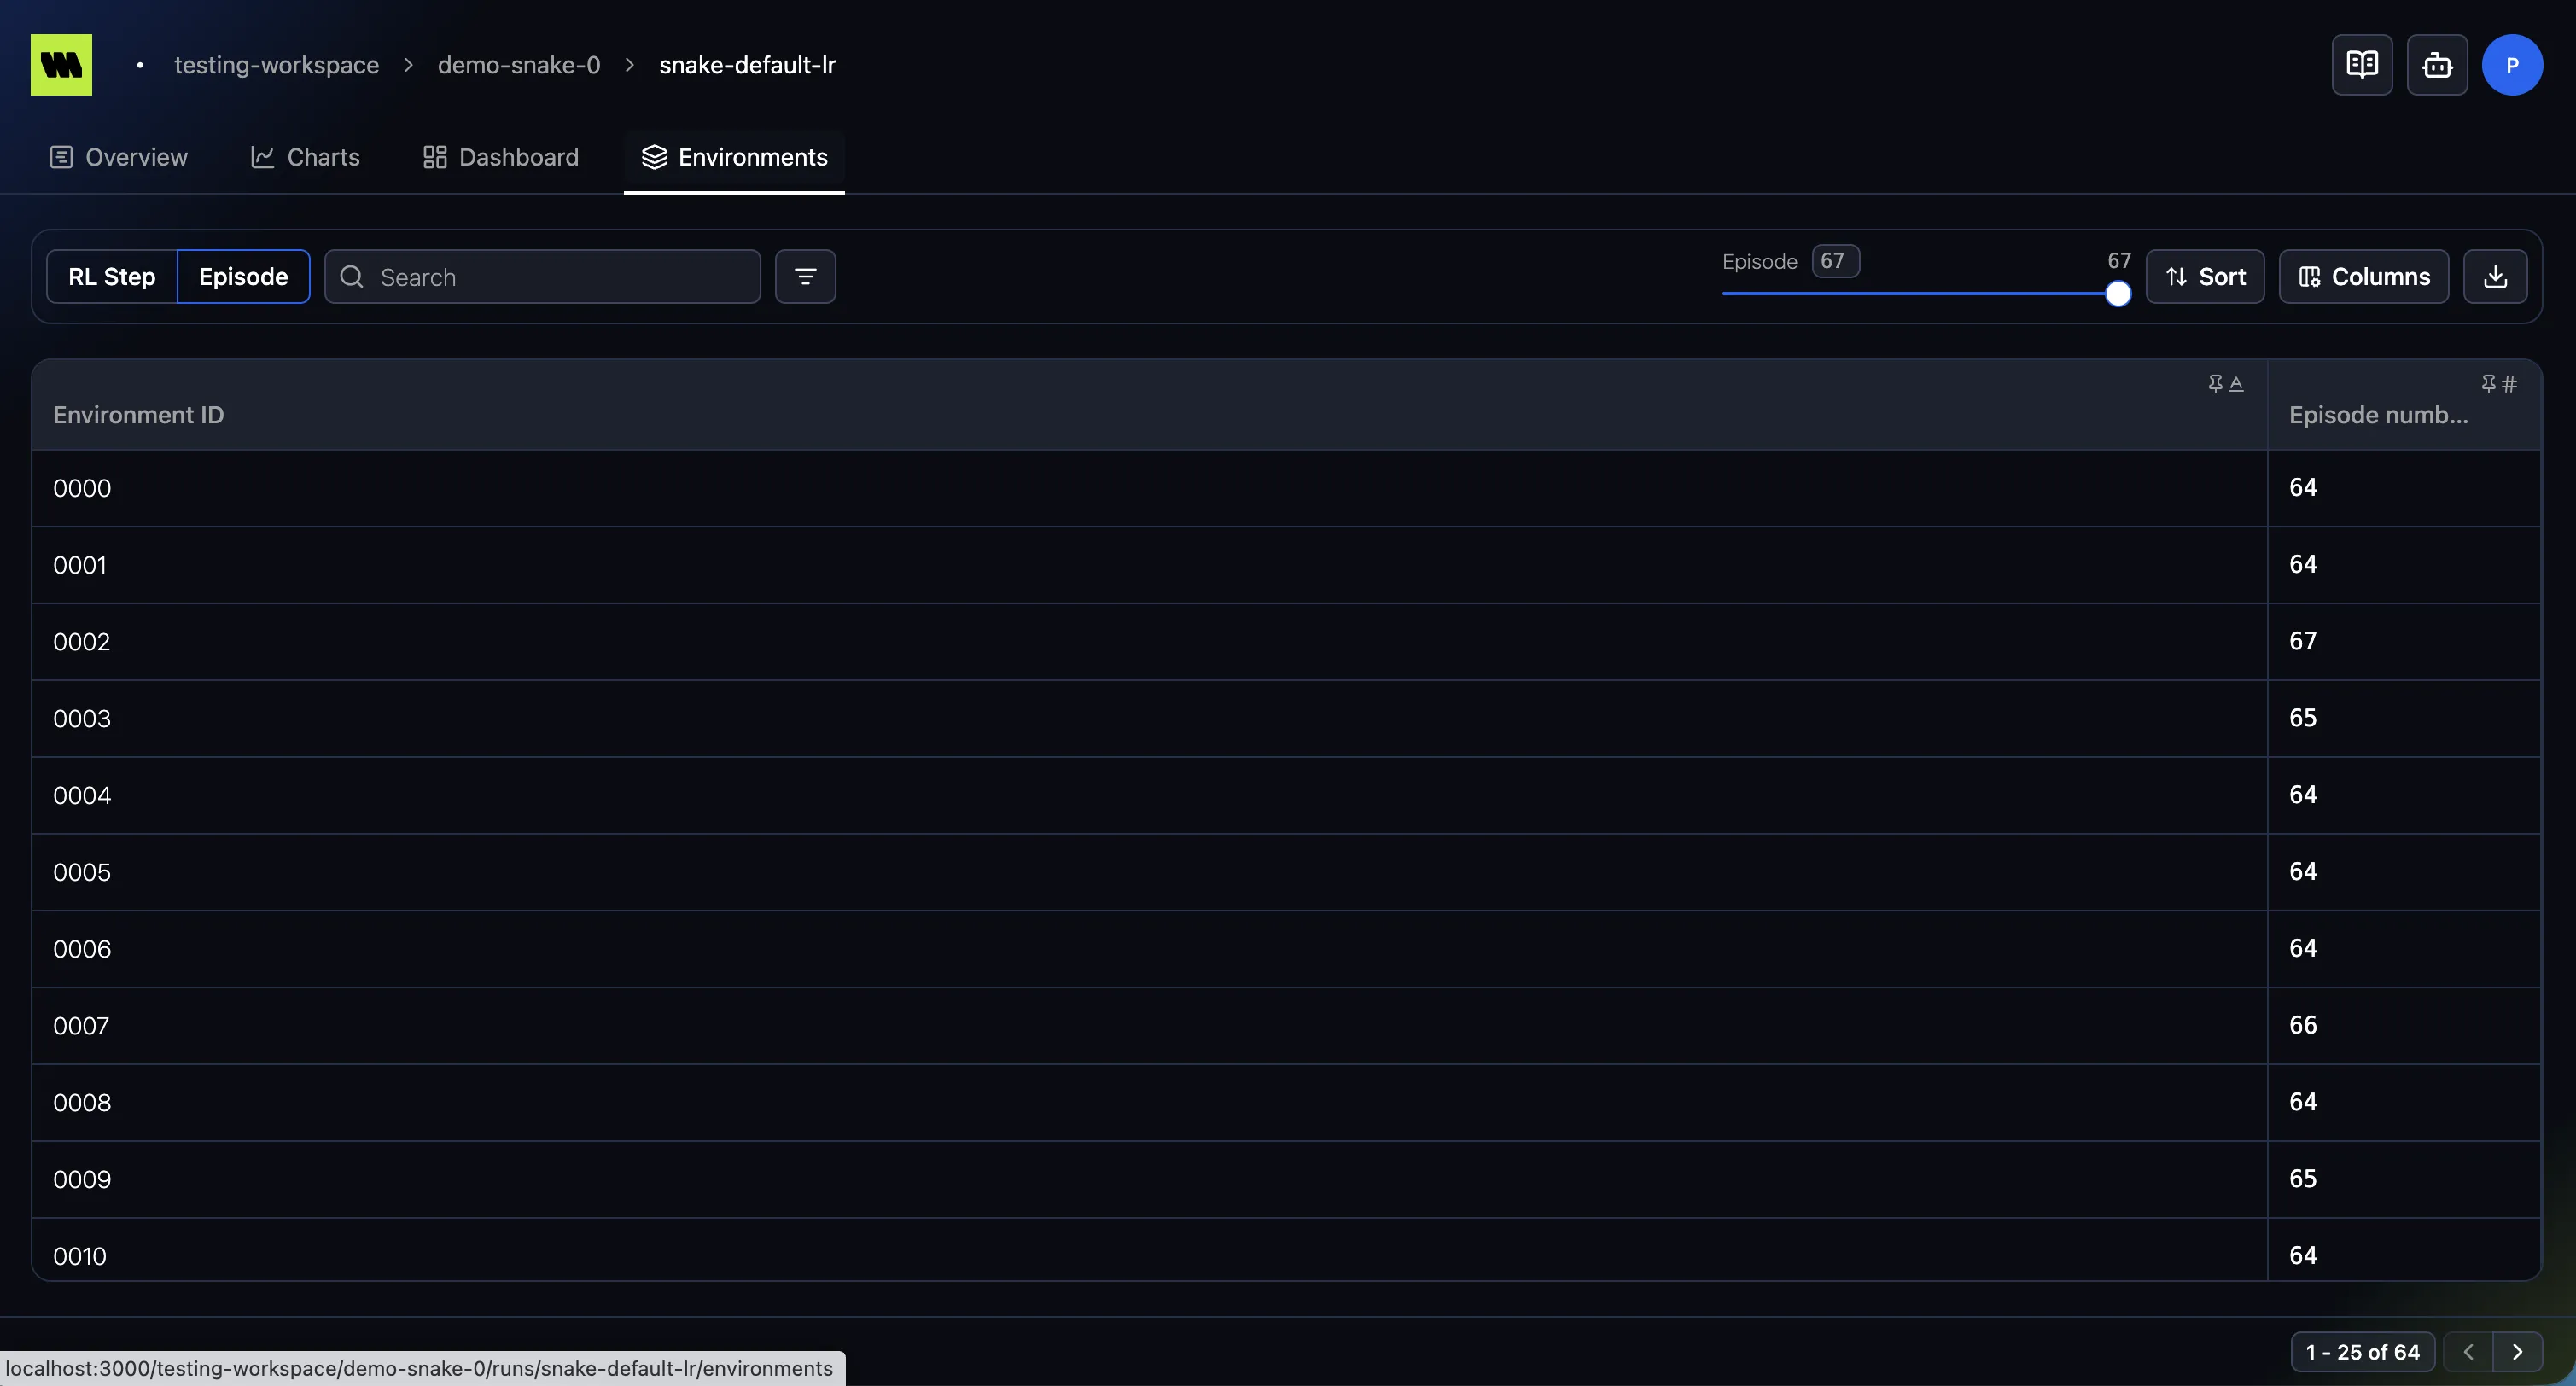
The environments table
Section titled “The environments table”Each row is an environment. Two columns are always shown, pinned to the left:
- Environment ID — the environment’s
env_id. Click it to open the environment’s charts. - Episode number — the episode selected for that environment at the current scale position: on the Episode scale, the requested episode (capped at its latest); on the RL Step scale, the latest episode that contains the selected RL step.
Add more columns from Columns to compare environments at a glance:
- Latest episode — the highest episode number the environment has logged.
- Latest RL step — the highest RL step the environment has logged.
- Metric summaries — any logged metric (such as
rewardorloss) aggregated as avg, min, max, first, last, sum, count, or std at the selected scale point.
The table uses the shared table controls — add / remove / reorder / resize columns, sort, and export to CSV. Here, search matches the Environment ID and filters apply to metric summaries.
Scale toggle & RL step slider
Section titled “Scale toggle & RL step slider”Above the table you choose how to position in time (see Episodes & steps):
- RL Step / Episode toggle — pick which scale to navigate by.
- The slider scrubs to a specific RL step (or episode), and the table updates to reflect that point.
Opening an environment
Section titled “Opening an environment”Click an environment’s id to open it. A single environment has two tabs:
- Overview — inspect its attributes at a chosen episode.
- Charts — visualize that environment’s metrics.
Opening one lands on the tab you used last there, defaulting to Charts.
Comparing environments
Section titled “Comparing environments”The table shows one number per environment at a single point in time. To compare their curves, use the run’s two other environment tabs:
- Compare — overlay several environments’ metrics on shared charts.
- Side-by-side — lay them out in an environment × metric grid.
Use the visibility control on a table row to add an environment to the comparison.