Side-by-side view
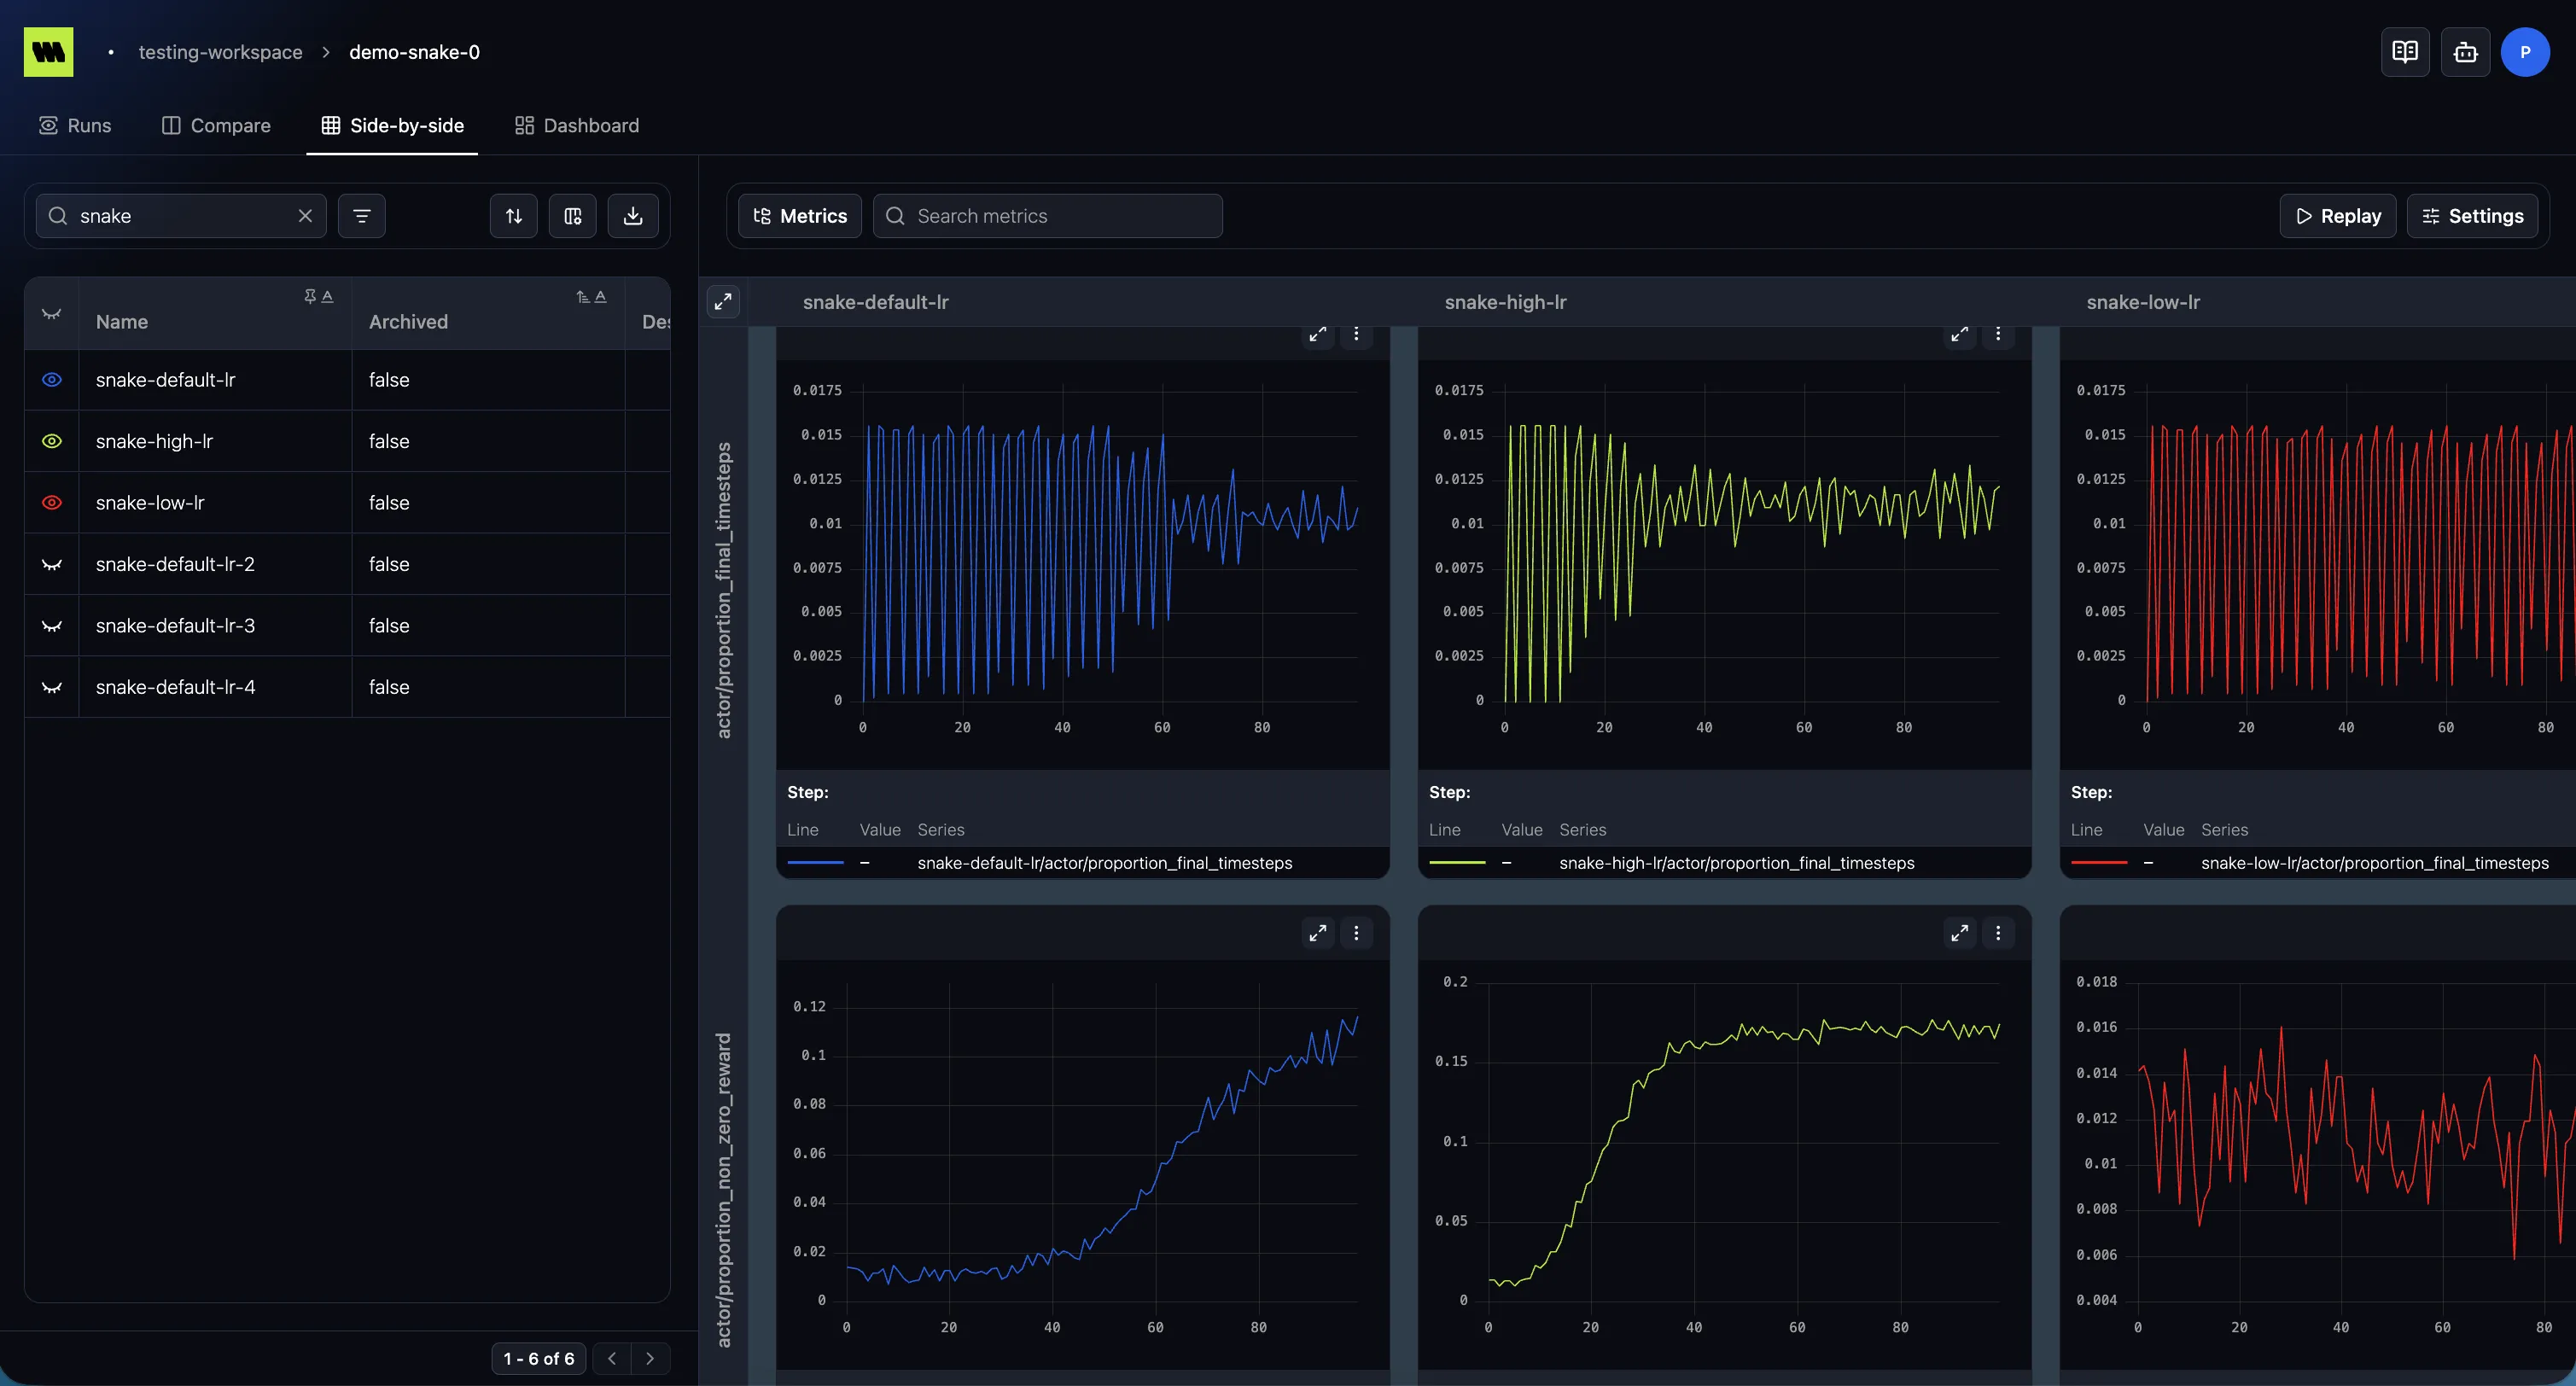
The Side-by-side view lays runs out in a grid: one column per run and one row per metric, so each run’s metrics sit in their own column rather than overlaid on shared axes.
How it works
Section titled “How it works”Selection works just like Compare: pick runs in the left list and metrics in the middle tree. The right panel then fills a grid:
- Columns are runs; their names stay pinned along the top as you scroll.
- Rows are metrics; their names stay pinned down the left side.
- The grid is virtualized, so it stays responsive with many runs and metrics.
- Use the fullscreen toggle (top-left of the grid) to expand it.
Settings and Replay behave as they do in Compare, and each cell is a normal chart.
When to use it
Section titled “When to use it”- Side-by-side — best when you want each run’s curves kept separate and aligned for scanning across a matrix.
- Compare — best when you want runs overlaid on the same axes to spot differences directly.