Metrics & series
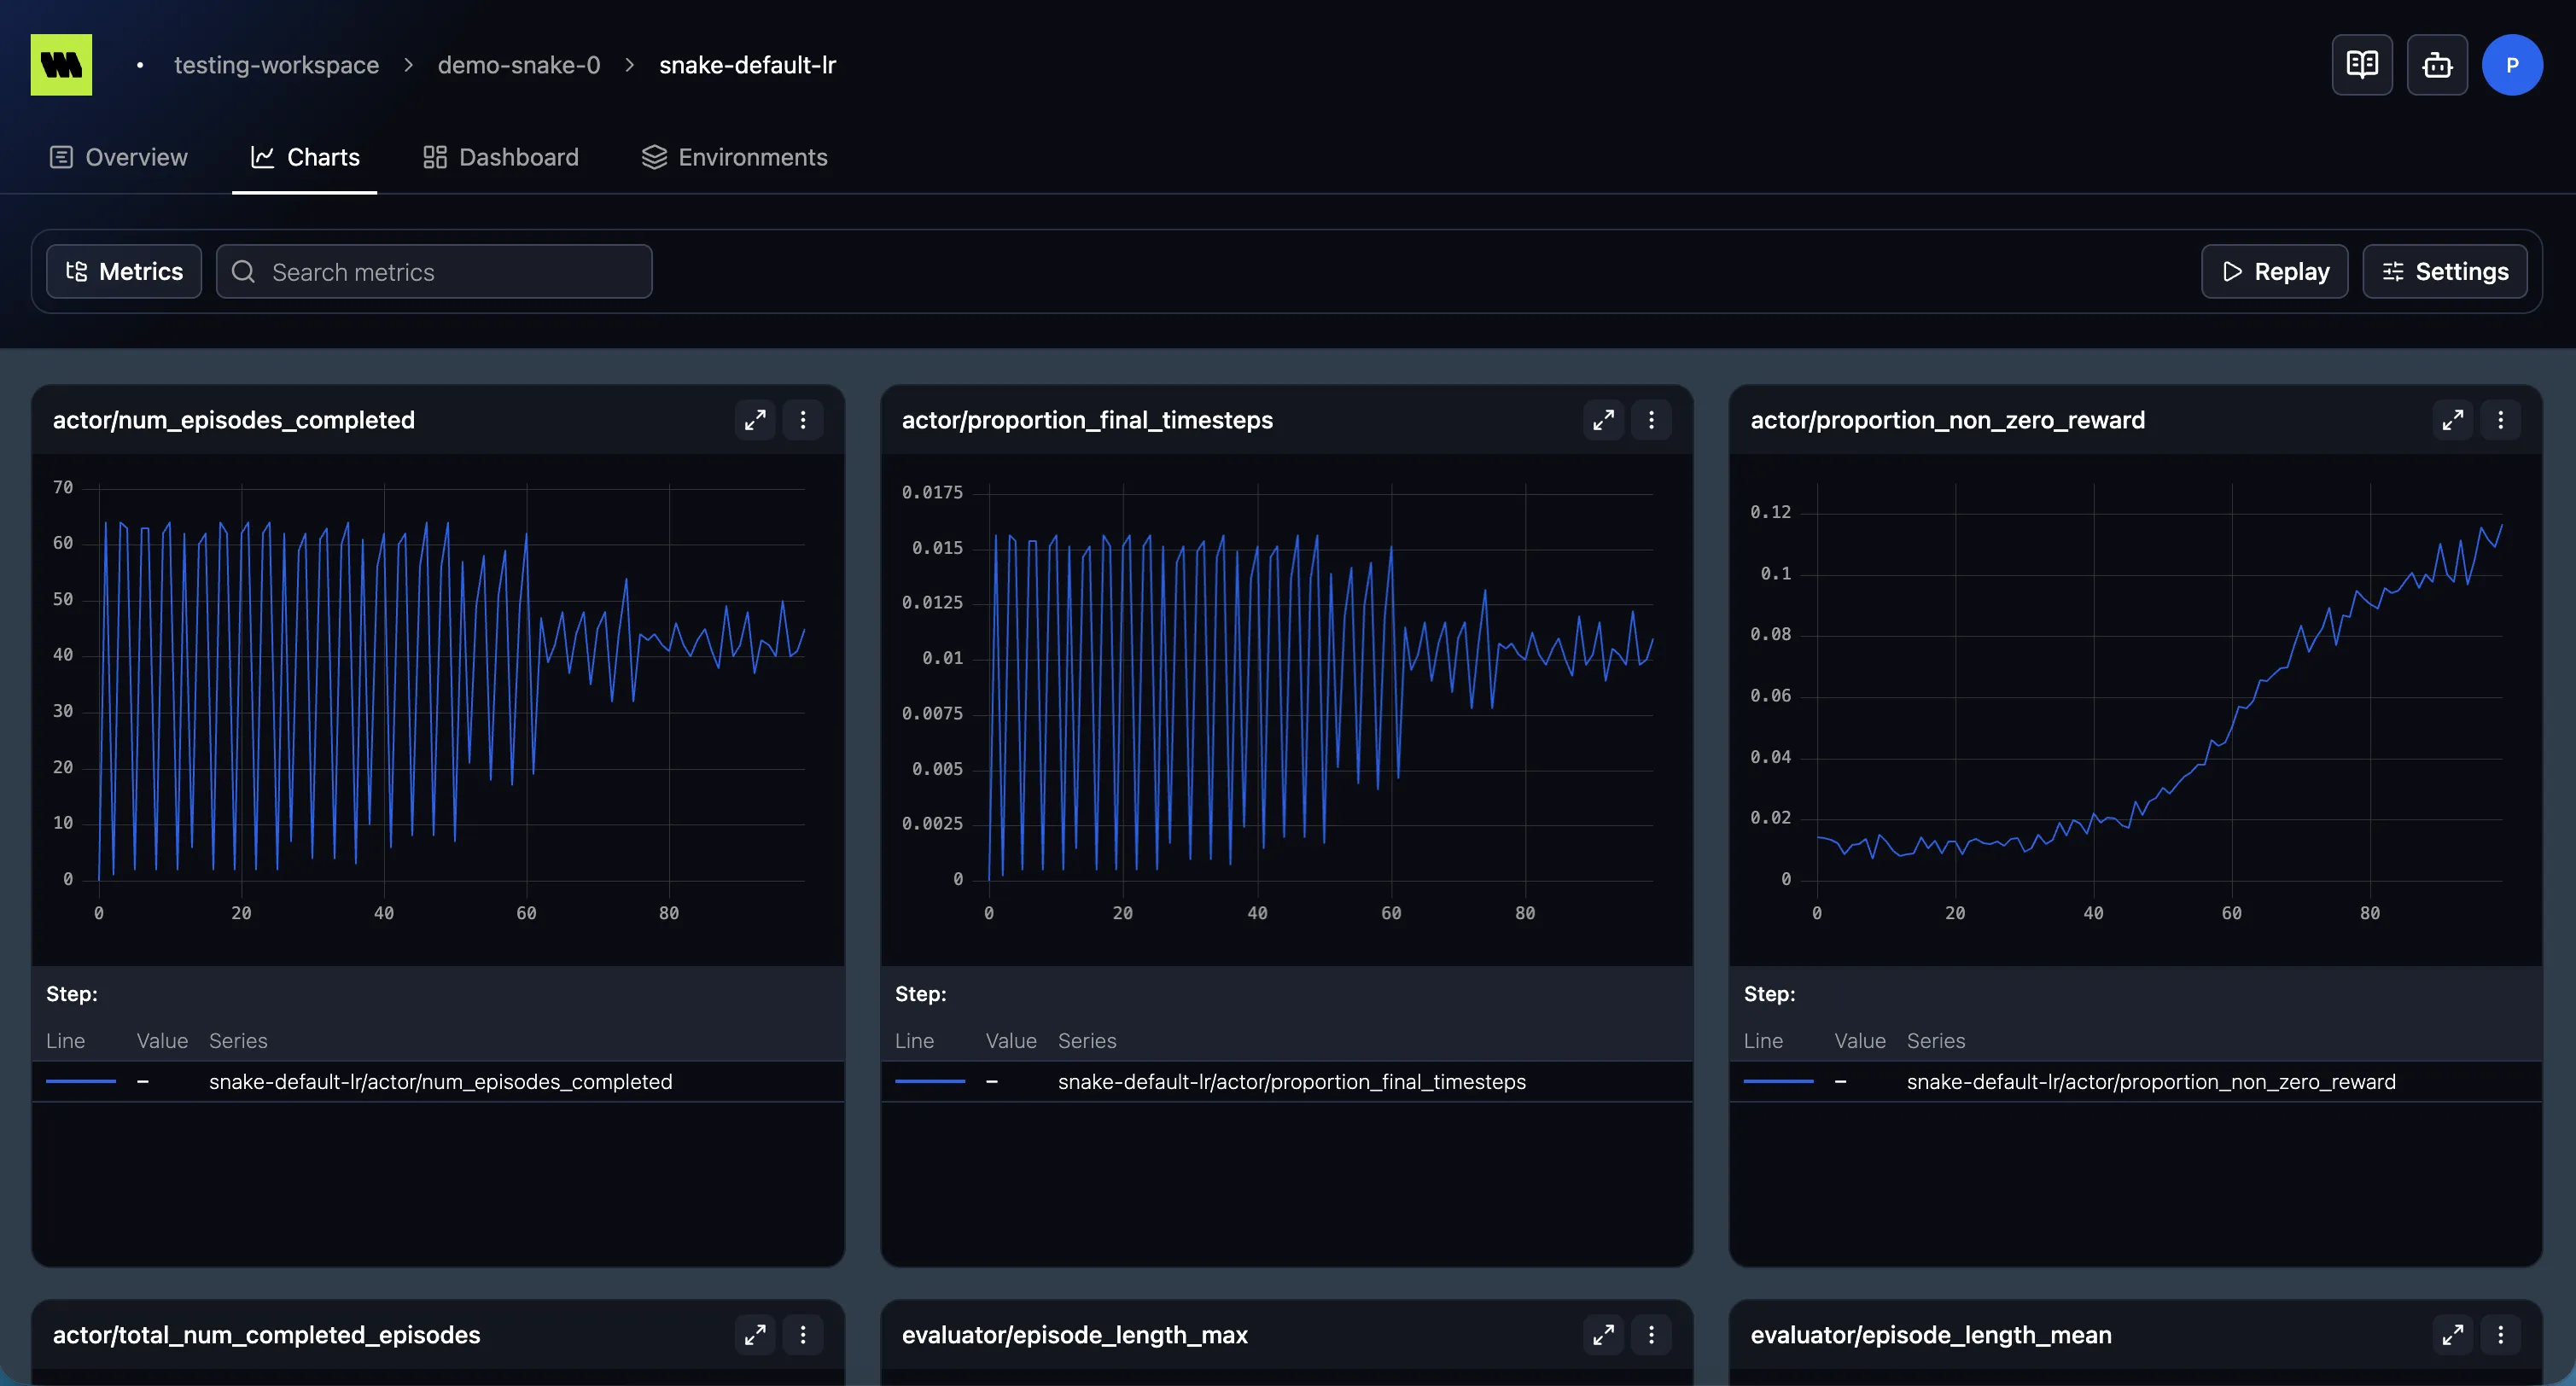
Charts plot your metrics. You choose which metrics to show from the metrics tree — the panel on the left of the Charts, Compare and Side-by-side.
What gets plotted
Section titled “What gets plotted”Selecting a metric plots its series. Remember that the same name can map to more than one series if it was logged on different scales or with different labels — see Metrics, series & attributes.
How each chart looks — axis scale, smoothing, x-axis — is controlled by chart settings. What you can do with a chart (zoom, tooltip, export, fullscreen) is covered in Charts.