
Histograms
A histogram metric records a whole distribution at each step — the weights of a layer, its activations, or
its gradients — instead of a single number. Log one with
metrana.log_histogram. In the
metrics tree, histograms have a bar-chart icon, and density histograms an
area-chart icon.
Histograms can be plotted on a run’s Charts view, in Compare, and in Side-by-side.
Reading a histogram chart
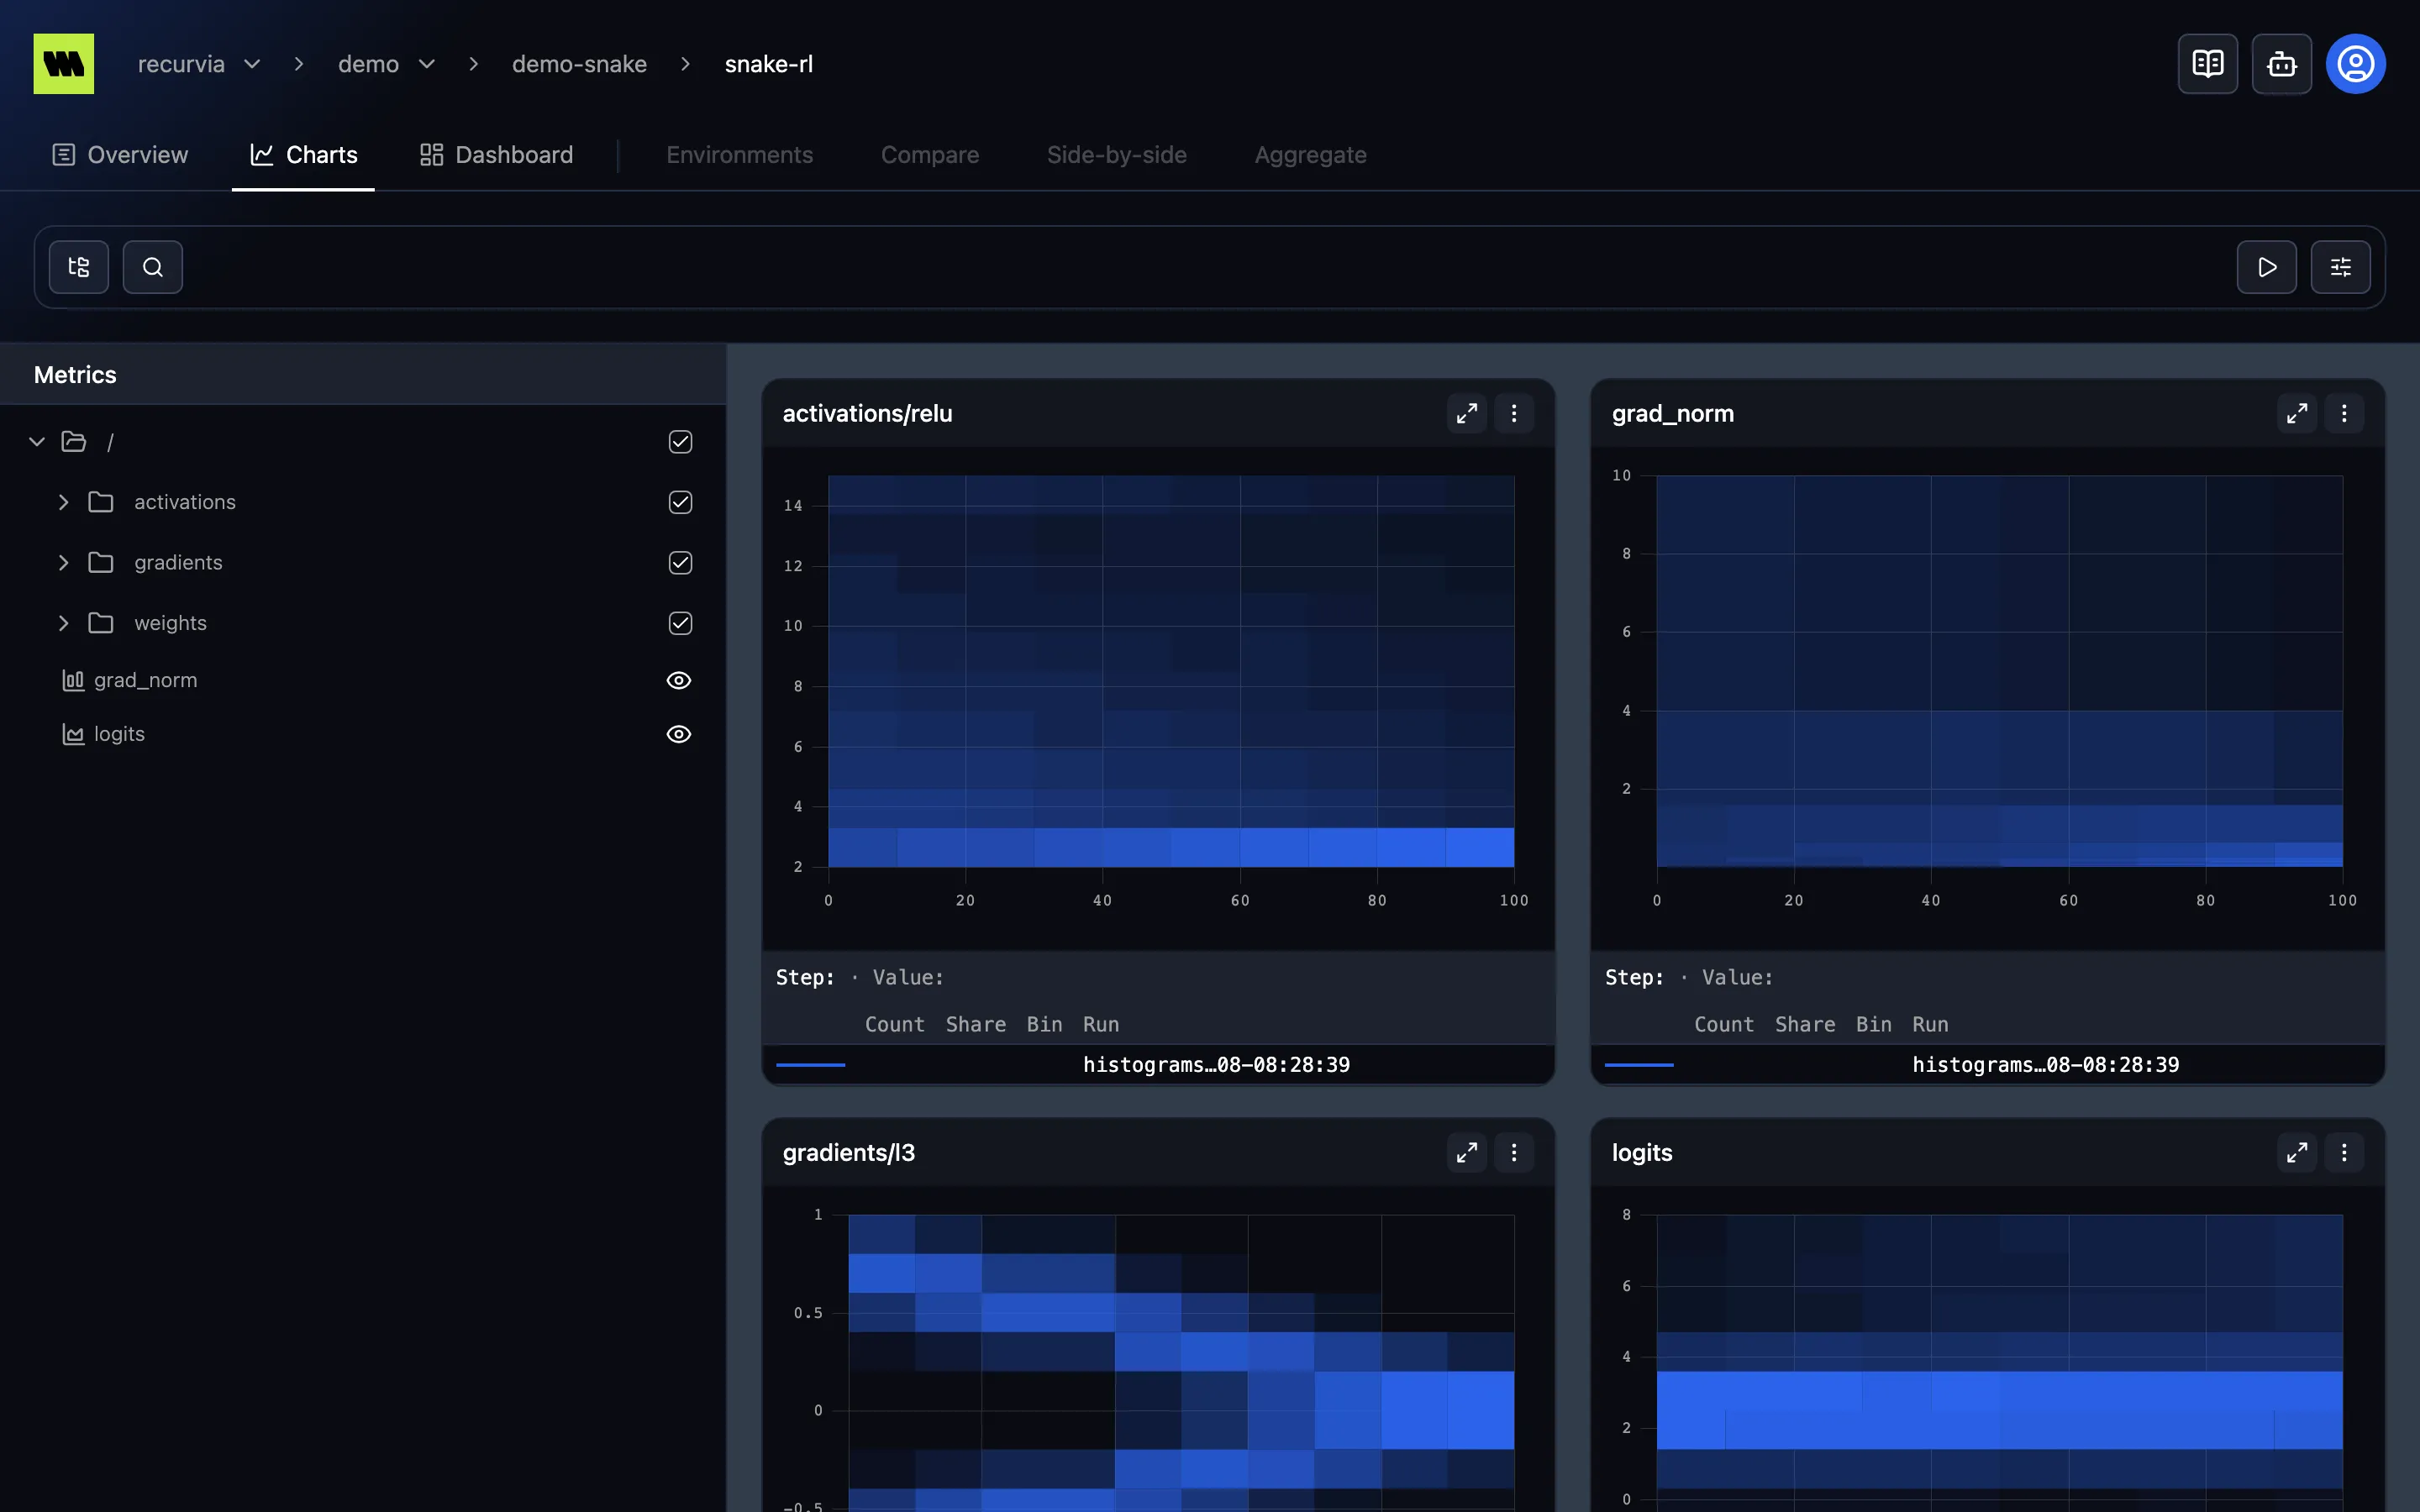
Section titled “Reading a histogram chart”A histogram chart is a heatmap:
- Across — steps, like any other chart.
- Up — the values the distribution covers, split into bins.
- Shade — how many values fell into each bin at that step: the more values, the more solid the cell’s color. Shading is scaled per run, so each run’s distribution reads on its own terms.
With several runs, each step’s column is split into a slice per run, in the run’s color.
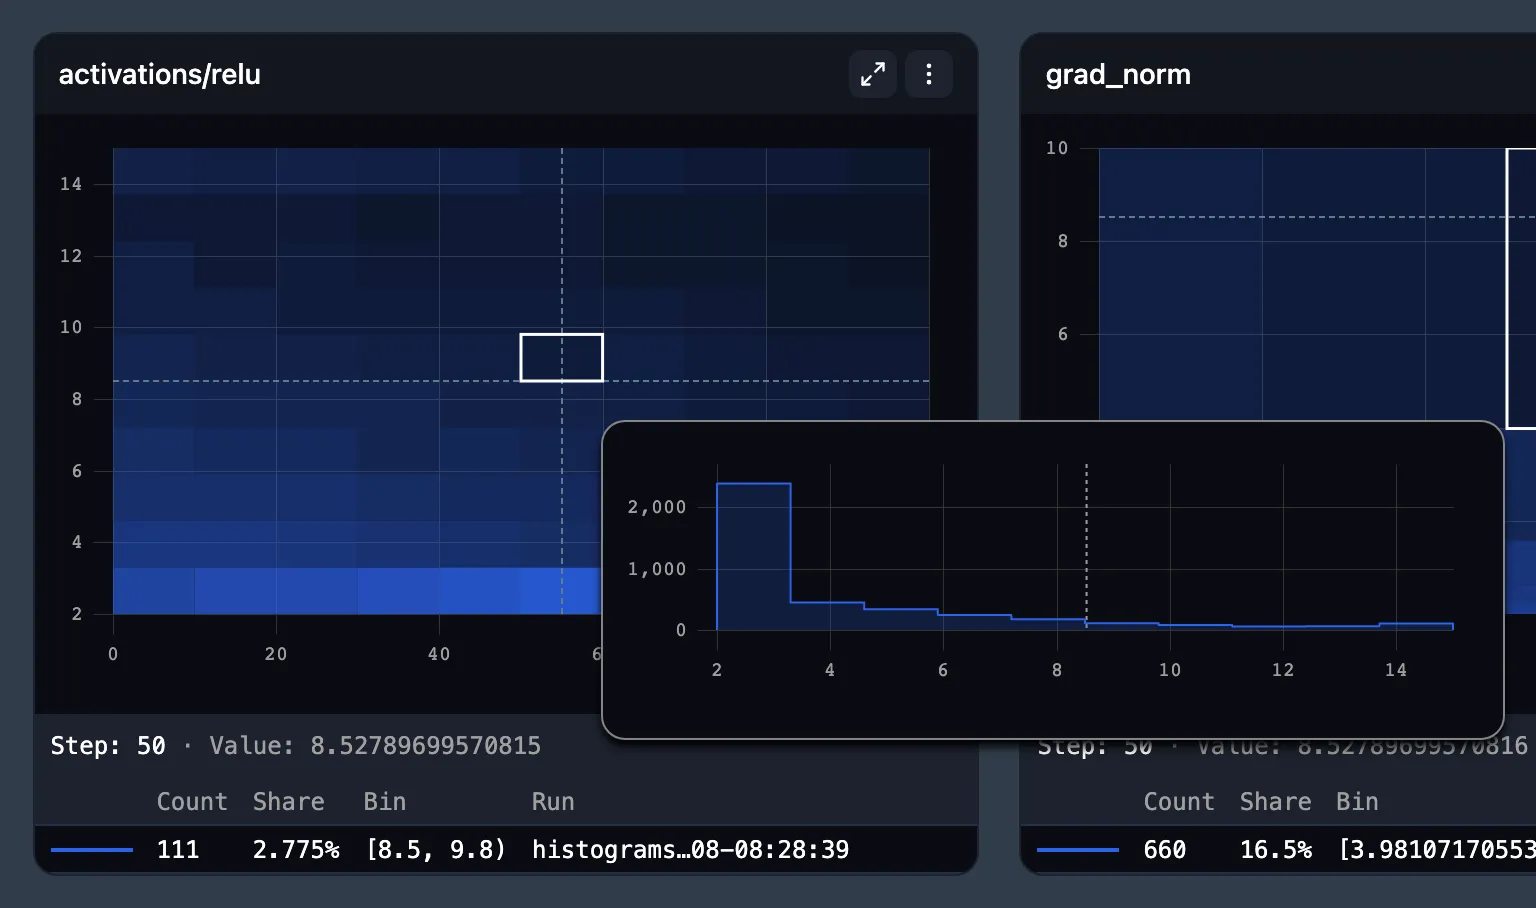
Hover the chart and a small panel follows the pointer, drawing each run’s distribution at that step as an outline — the cross-section the heatmap can’t show.
The tooltip
Section titled “The tooltip”The tooltip header shows the Step and the Value under the pointer. Below it, a row per run gives:
| Column | What it shows |
|---|---|
| Count or Density | The bin’s count (or density, for density histograms) |
| Share | The bin’s share of the run’s values at that step |
| Bin | The bin’s range, such as [0.1, 0.2) |
| Run | The run |
A column per label key follows when the metric has labels. As on line charts, you can hide or isolate a run from its row — except in Side-by-side, where each chart shows a single run.
Zoom, settings, and export
Section titled “Zoom, settings, and export”- Zoom works as on line charts: the x-range is shared with the page’s other charts, the y-range stays on the chart you zoomed.
- Settings don’t apply: histograms have no smoothing, log scale, x-axis mode, or reference lines. Their ⋮ menu only has Export as image and Export as CSV.
- Export as CSV downloads the bins of the runs you can see, for the zoomed range — see Exporting data.
Histograms can’t be added to dashboards, and their labels can’t be filtered.