
Series & labels
A metric can be logged with labels — key/value pairs such as layer="3" or policy="greedy" that split it
into several series, one per combination of values. Logging with
the SDK’s evaluation= flag works the same way: it adds an evaluation label, so evaluation and training points
become separate series of one metric.
How labeled metrics are plotted
Section titled “How labeled metrics are plotted”A labeled metric still gets one chart, with a line for every series of every run:
- Lines of the same run share the run’s color and are told apart by dash pattern.
- The chart’s tooltip has a column for each label key, so you can see which line is which.
A metric with many label values can draw a lot of lines. Filter its labels to plot only the series you need.
Filter a metric’s labels
Section titled “Filter a metric’s labels”In the metrics tree, a labeled metric shows a chip with a tag icon and its label keys. Click it to open the metric’s labels:
- Each label key lists its values with checkboxes. Keys with nine or more values get a Search <key> box; up to 200 values are listed at a time, then Showing X of Y, refine the search.
- Check the values you want. Within one key, a series matches any of its checked values; across keys, it must match every key you’ve checked something in. A key with nothing checked doesn’t filter.
- The footer counts the matching series (N series selected). Reset clears the filter and plots every series again.
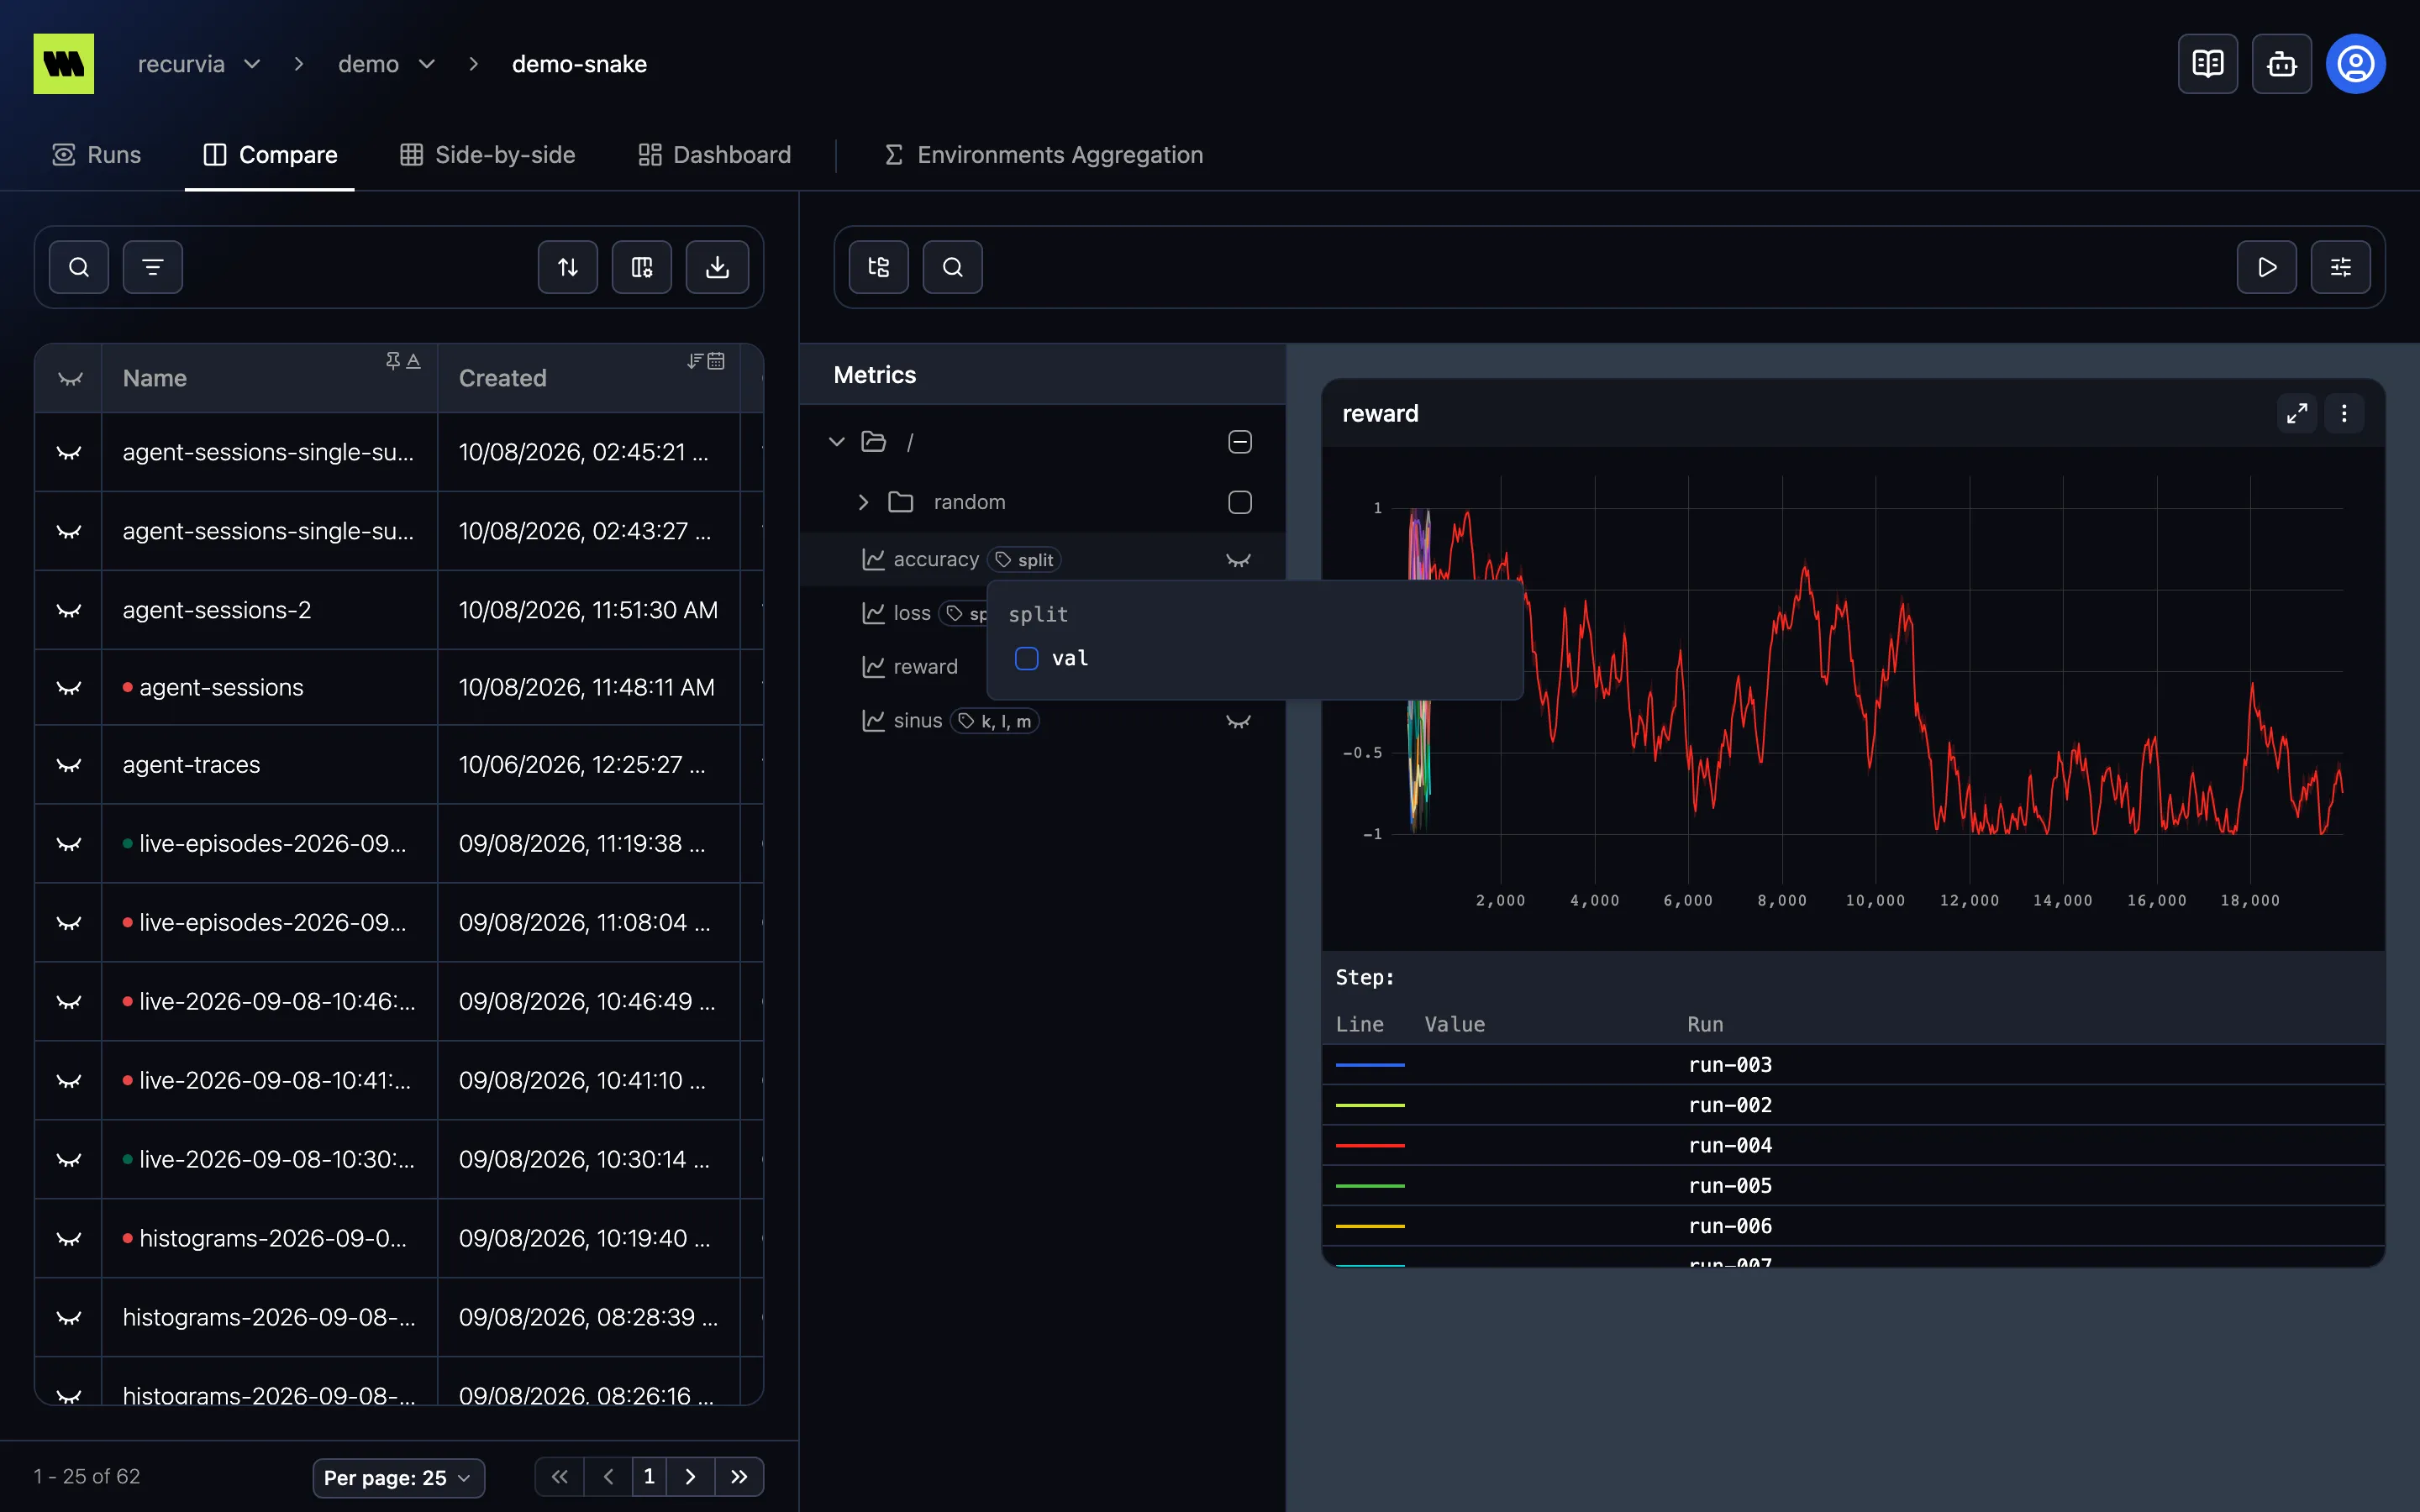
Changes apply straight away. While a filter is on, the chip turns into a key=value badge with an amber border
— hover it to see every condition — and the metric’s chart shows the same badge next to its title.
A checked value shown grayed out, marked (no series) on hover, matches nothing in the runs you’re viewing. It usually comes from a link made while viewing other runs.
Histograms can’t be filtered by label; their chart shows all their series.
Labels elsewhere
Section titled “Labels elsewhere”The same label chip appears wherever you pick a metric:
- Tables — a metric summary used as a column, filter, or sort item can be narrowed to some series. There, your choice applies when you close the popup. See Tables.
- Dashboards — each metric in a chart’s dialog can have its own label filter. See Dashboards.