
Reading a trace
Picking a trace in the traces or sessions table opens it on the right of the Traces tab. The trace reads top to bottom as a transcript: what the agent was asked, each span in the order it ran, and what the agent answered.
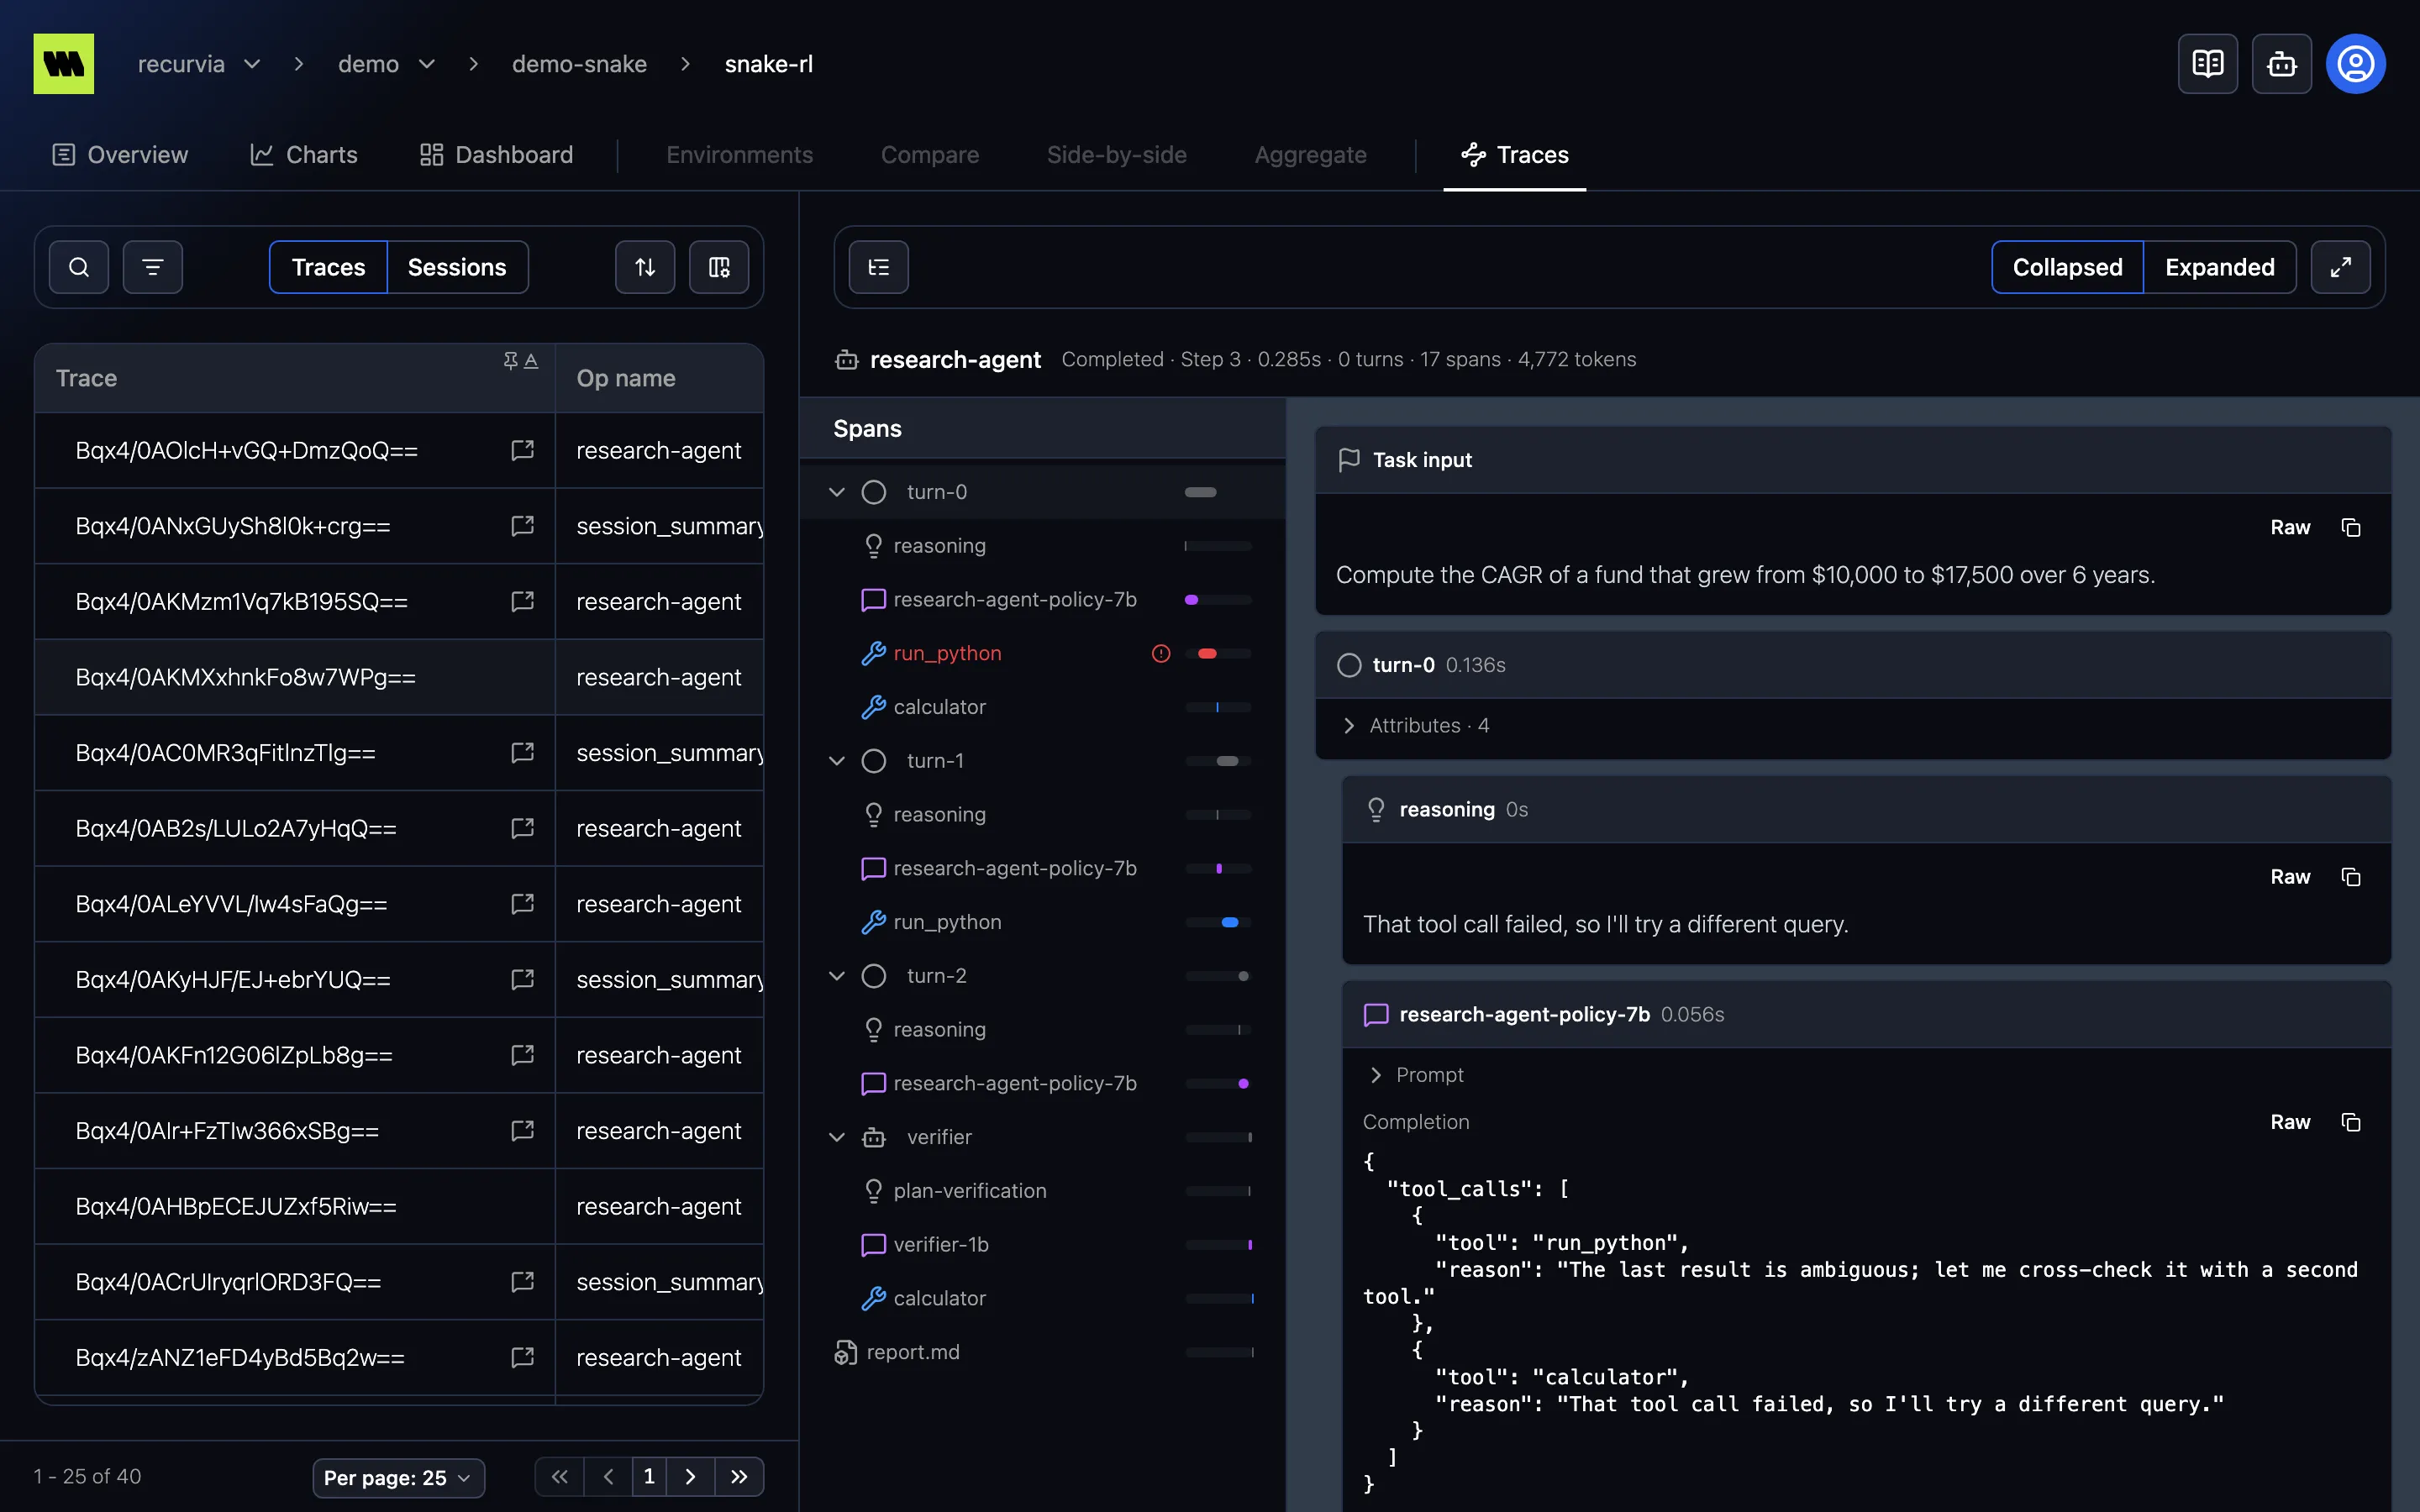
Toolbar and summary
Section titled “Toolbar and summary”The toolbar above the trace has:
- Spans (left) — show or hide the span navigator.
- The task control (center) — only for a task of a session.
- Collapsed | Expanded (right) — how much of each long block the transcript shows. Collapsed, the default, cuts blocks taller than 320 pixels short, each with an Expand button; Expanded shows every block in full. Your choice is remembered in your browser.
- Fullscreen / Exit fullscreen (right) — give the trace the whole window. Esc also exits.
Below the toolbar, a line sums the trace up: its root span’s name, then its status, Step, duration, and how many turns, spans, and tokens it has. A session summary shows the session’s Reward and number of tasks instead.
Tasks in a session
Section titled “Tasks in a session”When the trace is a task of a session, the toolbar’s task control shows where it sits: Task 2 / 5, or Summary for the session’s summary. Use the arrows (Previous task / Next task), or [ and ], to step through the session, or open the control for an overview of the whole session:
- the session ID, its Reward, the agent, and how many tasks it has — 3 of 5 tasks recorded when some weren’t logged
- a row per task with its number, Started, Duration, Status, and Tokens, and the summary last, marked with a flag
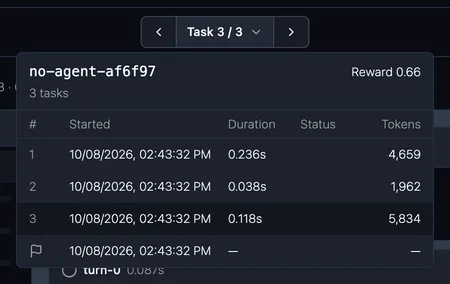
Click a row to open it. At the end of each task’s transcript, Continue to task N (or Continue to summary) moves on. If the session can’t be loaded, the control offers Retry session.
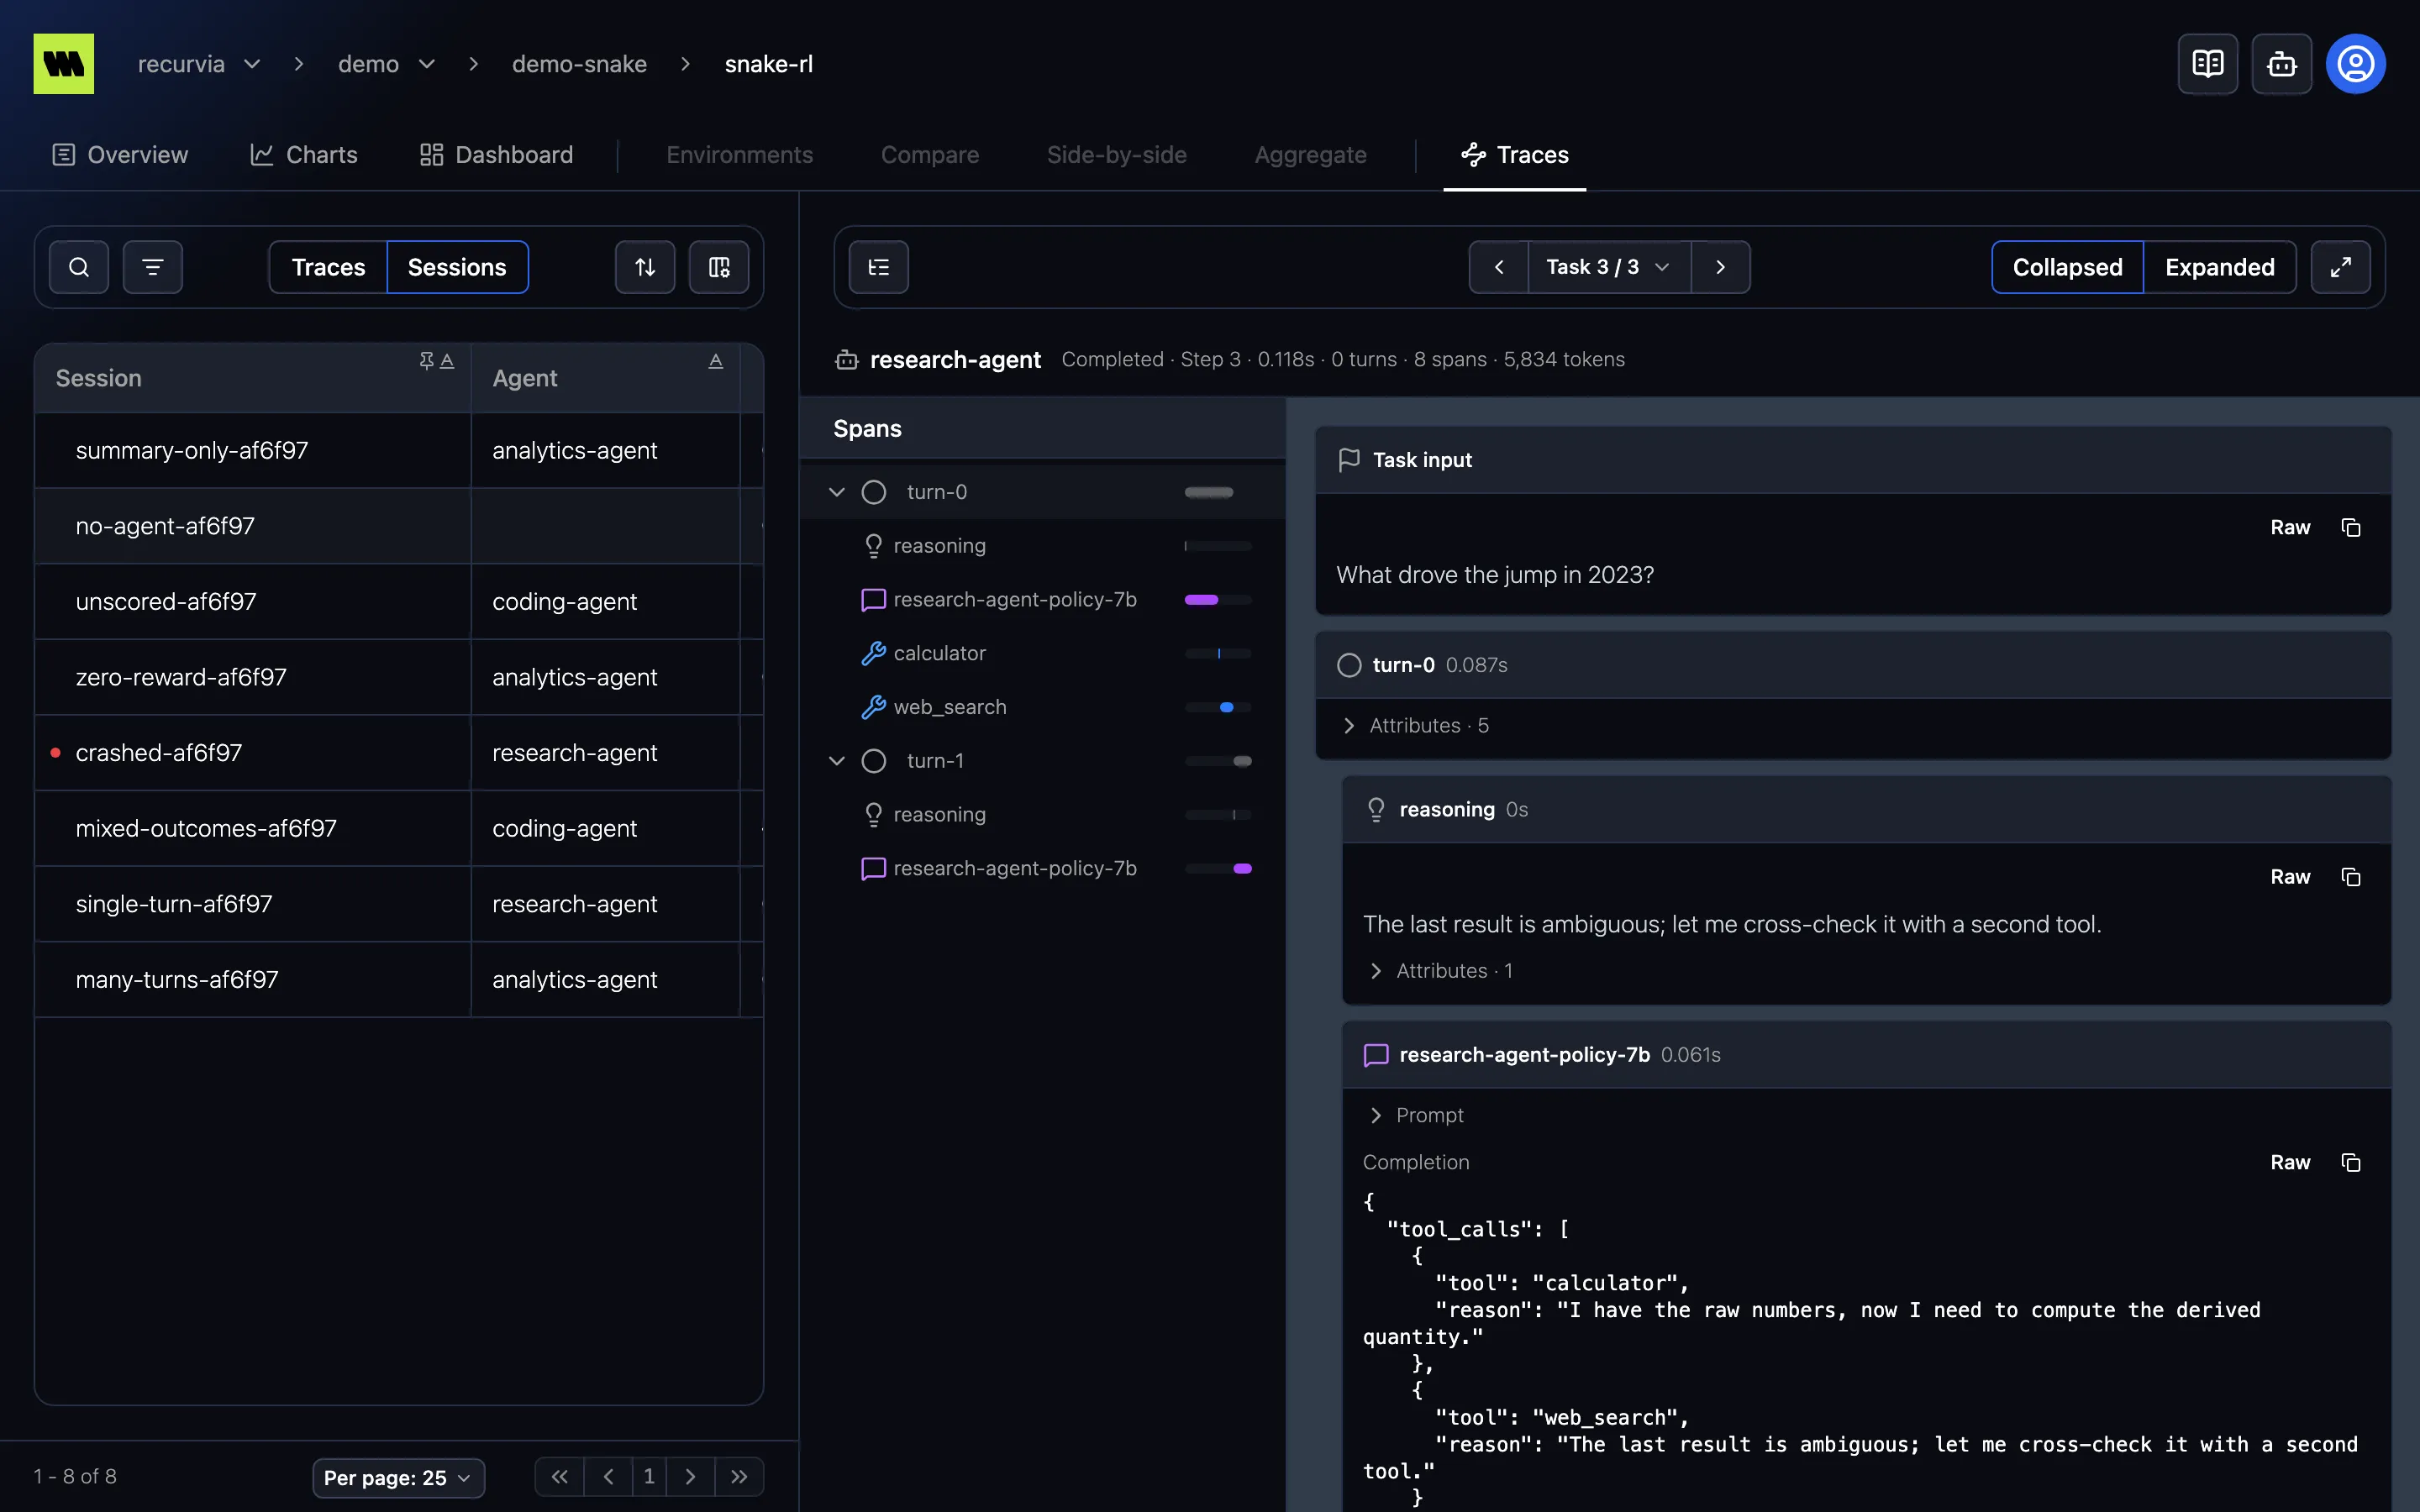
Span navigator
Section titled “Span navigator”The Spans panel on the left lists the trace’s spans as a tree, each with its kind icon and name. A span that failed shows an error icon; a collapsed branch shows how many spans it holds. When the panel is wide enough, each row also has a small timeline bar showing when the span ran within the trace, colored by kind and red for errors.
Click a span to jump to it in the transcript. The span is kept in the URL, so a link opens the trace at that span. As you scroll the transcript, the navigator highlights the span you’re reading.
Drag the panel’s edge to resize it. Its size, and whether it’s open, are remembered. The navigator lists up to the first 9,999 spans of a very large trace.
The transcript
Section titled “The transcript”The transcript starts with the Task input and ends with the Final output, plus the trace’s Attributes. When the root span isn’t an agent — say, a single model call — these read Input and Output instead.
In between, every span appears in the order it ran, indented under its parent. Turn and Sub-agent spans become section headers that group the spans inside them. A turn’s header also shows its Reward when the agent logged it, and the current top-level turn’s header stays at the top as you scroll. Press j and k to jump to the next and previous turn. Each finished turn ends with a turn summary. Each other span is a block with its kind icon, name, and duration (running while it’s still going), holding its inputs and outputs:
| Span kind | What the block shows |
|---|---|
| LLM call | The Completion; the Prompt stays folded until you open it |
| Tool call | The tool’s Input and Output |
| Thought | The agent’s reasoning, with its Input folded |
| Function, Artifact | Its Input and Output |
Every span also has a folded Attributes section. A failed span shows its exception at the top of its block, with a button to copy it.
Prompts stay folded because they repeat the growing context of every earlier turn.
Turn summaries
Section titled “Turn summaries”When a turn finishes, a Turn summary block closes it, after the turn’s last span and level with its header, marked with a flag. Its title line sums the turn up: its status, duration, tokens, and Reward. The block holds the turn’s Output and its folded Attributes, with the exception at the top if the turn failed.
The summary shows only what the agent recorded on the turn itself. Tokens appear when the agent set a count on the turn, as a turn doesn’t add up the tokens of the spans inside it; the reward appears when the agent scored the turn; and the Output reads Empty unless the agent logged one.
How inputs and outputs are shown
Section titled “How inputs and outputs are shown”The portal recognizes what each input or output holds and shows it accordingly:
- Chat messages — OpenAI, Anthropic, and Gemini request and response formats are shown as a conversation, each message labeled System, Developer, User, Assistant, or Tool, including tool calls and their results.
- Images — embedded images (data URLs) are shown inline, up to 5 MB; larger ones say Image too large to preview. Images hosted elsewhere are never loaded — they’re shown as a link — so opening a trace sends no requests to hosts in your agent’s output.
- JSON — pretty-printed.
- Markdown — prompts, completions, thoughts, and the task input and final output are rendered as Markdown. Diagram and math blocks are shown as their source.
- Plain text — everything else, with terminal color codes stripped.
Formatted blocks have a Raw / Pretty switch to see exactly what was logged, and every block with content has a copy button. Very large blocks (over 200,000 characters) open raw, as they’d be slow to render.
A block can also say:
- Available when the span finishes — the span is still running.
- Empty — nothing was logged.
- Truncated at ingestion — the SDK cut the payload; the block shows how much was logged.
Large payloads
Section titled “Large payloads”Inputs and outputs load as you scroll to them. Each one first loads its first 256 KB; Load more doubles that, up to 2 MB, after which the block says how much it’s showing.
Running traces
Section titled “Running traces”While a trace is still running, the portal refreshes it every 15 seconds, so new spans appear as the agent logs them. Spans that haven’t finished yet show running and fill in their outputs when they end.
When a trace won’t open
Section titled “When a trace won’t open”- Trace not found — the trace belongs to another run, or the link is wrong.
- Couldn’t load the trace — the portal couldn’t fetch it, or the trace’s root span hasn’t arrived yet.
- No spans — the trace hasn’t logged any spans yet.