
Environments aggregation
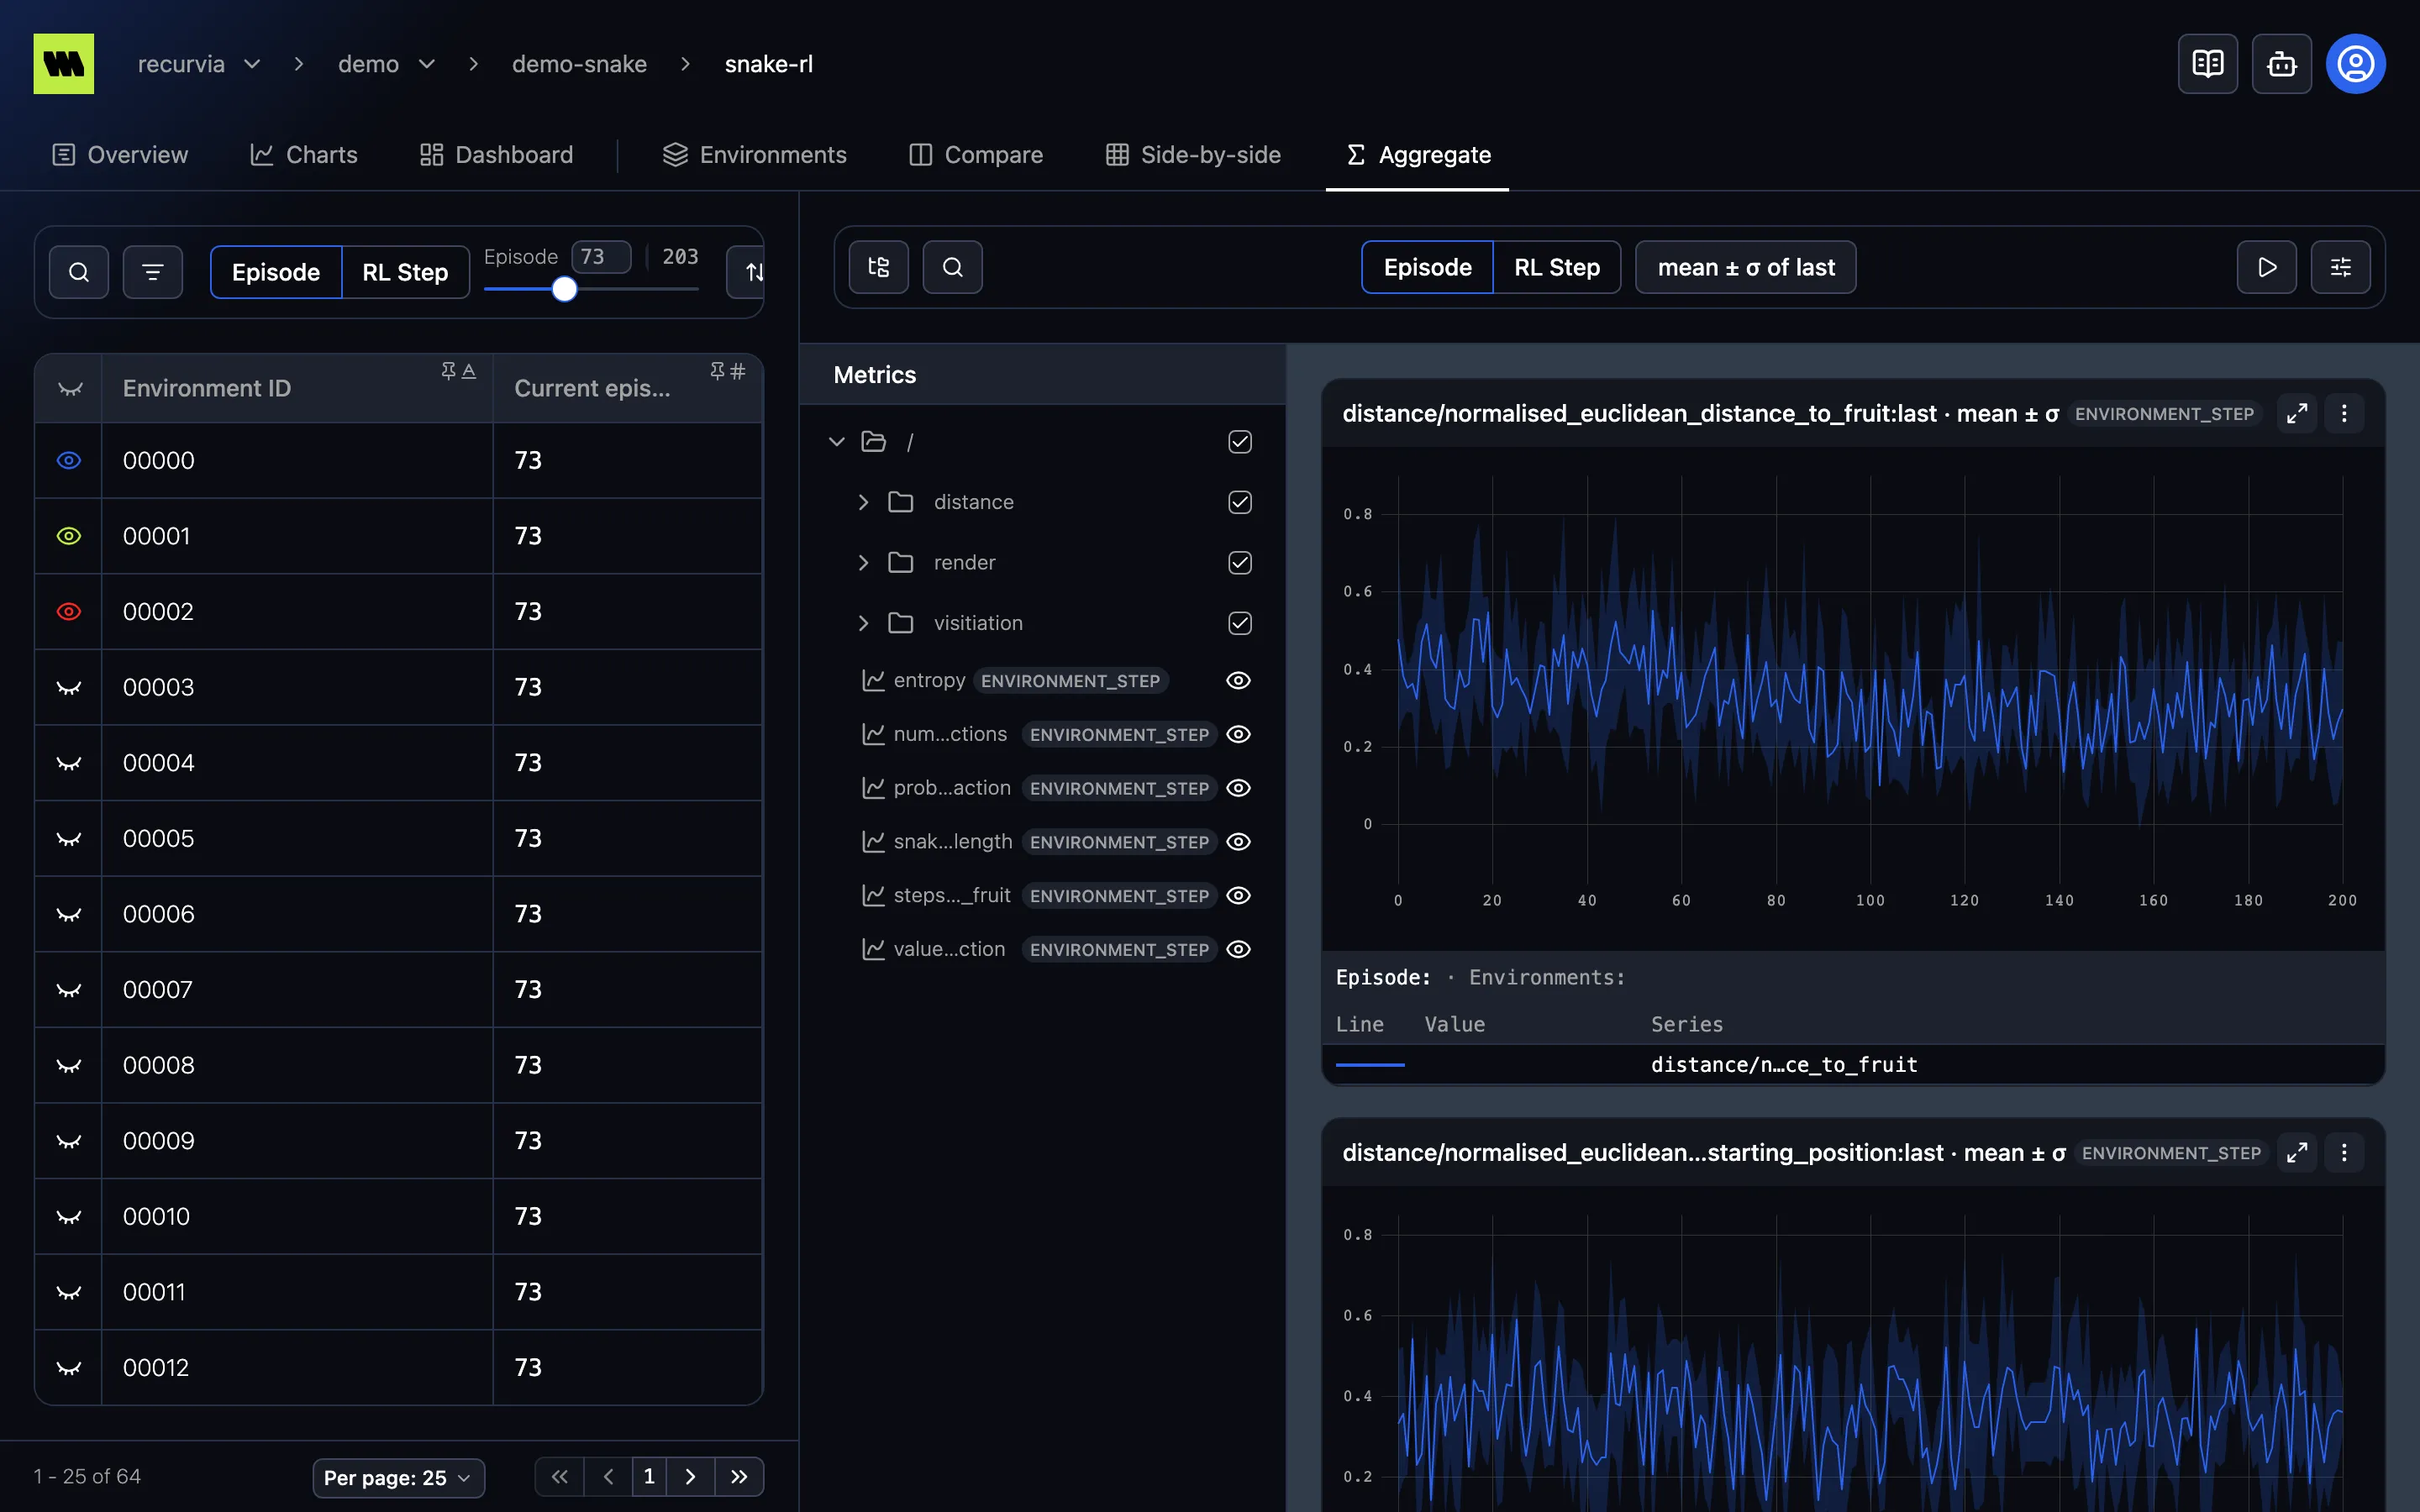
Environments aggregation lives on a run’s Aggregate tab (7), one of its environment tabs alongside Environments, Compare, and Side-by-side. Where Compare draws a line per environment, Aggregate collapses the environments you select into one line, with a shaded band for their spread — so a run with thousands of parallel environments still reads as a single curve per metric.
Like the other environment tabs, it’s disabled on a run that logged no environments.
How it works
Section titled “How it works”The view has the same three areas as Compare:
- Environments list (left) — select the environments to aggregate with the eye on their rows. The selection is shared with Compare and Side-by-side. Until you select one the charts show No environments selected.
- Metrics tree (middle) — choose which metrics to plot.
- Charts (right) — one chart per selected metric, drawn across the whole run.
The toolbar has the Episode | RL Step toggle, but no slider: instead of pinning one point in training, each chart’s x-axis walks the whole scale — every episode, or every RL step. See Episodes & steps. The environments list on the left keeps its own slider, which only moves the list’s Current episode column, not the charts.
Choose the aggregation
Section titled “Choose the aggregation”The Aggregation button in the toolbar names the current aggregation, such as mean ± σ of last. Open it to set the two halves:
- Within each environment — how each environment’s values at one episode or RL step are reduced to one number first: first, last (default), min, max, sum, avg, count, or std.
- Across environments — how those numbers combine into the line and its band:
| Option | Line | Band |
|---|---|---|
| mean ± σ (default) | mean | one standard deviation either side |
| mean ± 95% CI | mean | 95% confidence interval |
| mean + min/max | mean | the lowest to the highest value |
| mean | mean | none |
| median | median | none |
| min / max / sum | that value | none |
| none | one line per environment | none |
With none, nothing is combined: each environment keeps its own line, and the button reads, for example, last per environment.
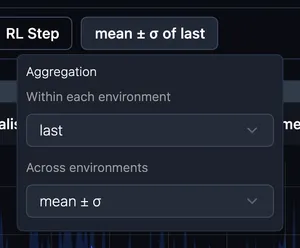
When you change either half, the panel says Changed from default and offers Reset. The aggregation is kept in the URL, so a link reproduces it.
Per-chart aggregation
Section titled “Per-chart aggregation”A chart’s ⋮ menu has the same two settings, so one metric can use a different aggregation from the rest of the page — say, max for a reward while everything else shows mean ± σ. A chart that differs from the page shows Overrides page aggregation, with Reset to return to the page’s choice.
Reading the charts
Section titled “Reading the charts”- The tooltip lists the aggregated line under Series — or, with none, each environment under Environment.
- Chart settings such as smoothing and y-axis scale work as usual; they’re kept separately from Compare’s. The x-axis mode is fixed to the selected scale.
- While the run is active, the charts refresh every 15 seconds — except while you’re zoomed in.
Aggregating across runs
Section titled “Aggregating across runs”To compare the same environment aggregate between runs — say, mean reward over all environments, for each of several training configurations — use the project’s Environments Aggregation tab.