
Environments aggregation across runs
Environments Aggregation is a project tab (5), next to Runs, Compare, Side-by-side, and Dashboard. It answers “how do these training configurations compare across all their environments?”: for each selected run, it collapses the run’s environments into one aggregated line with a shaded band, and overlays the runs on shared charts.
The tab is shown disabled in projects that logged no reinforcement learning environments. To aggregate the environments of a single run, see Environments aggregation on the run’s Aggregate tab.
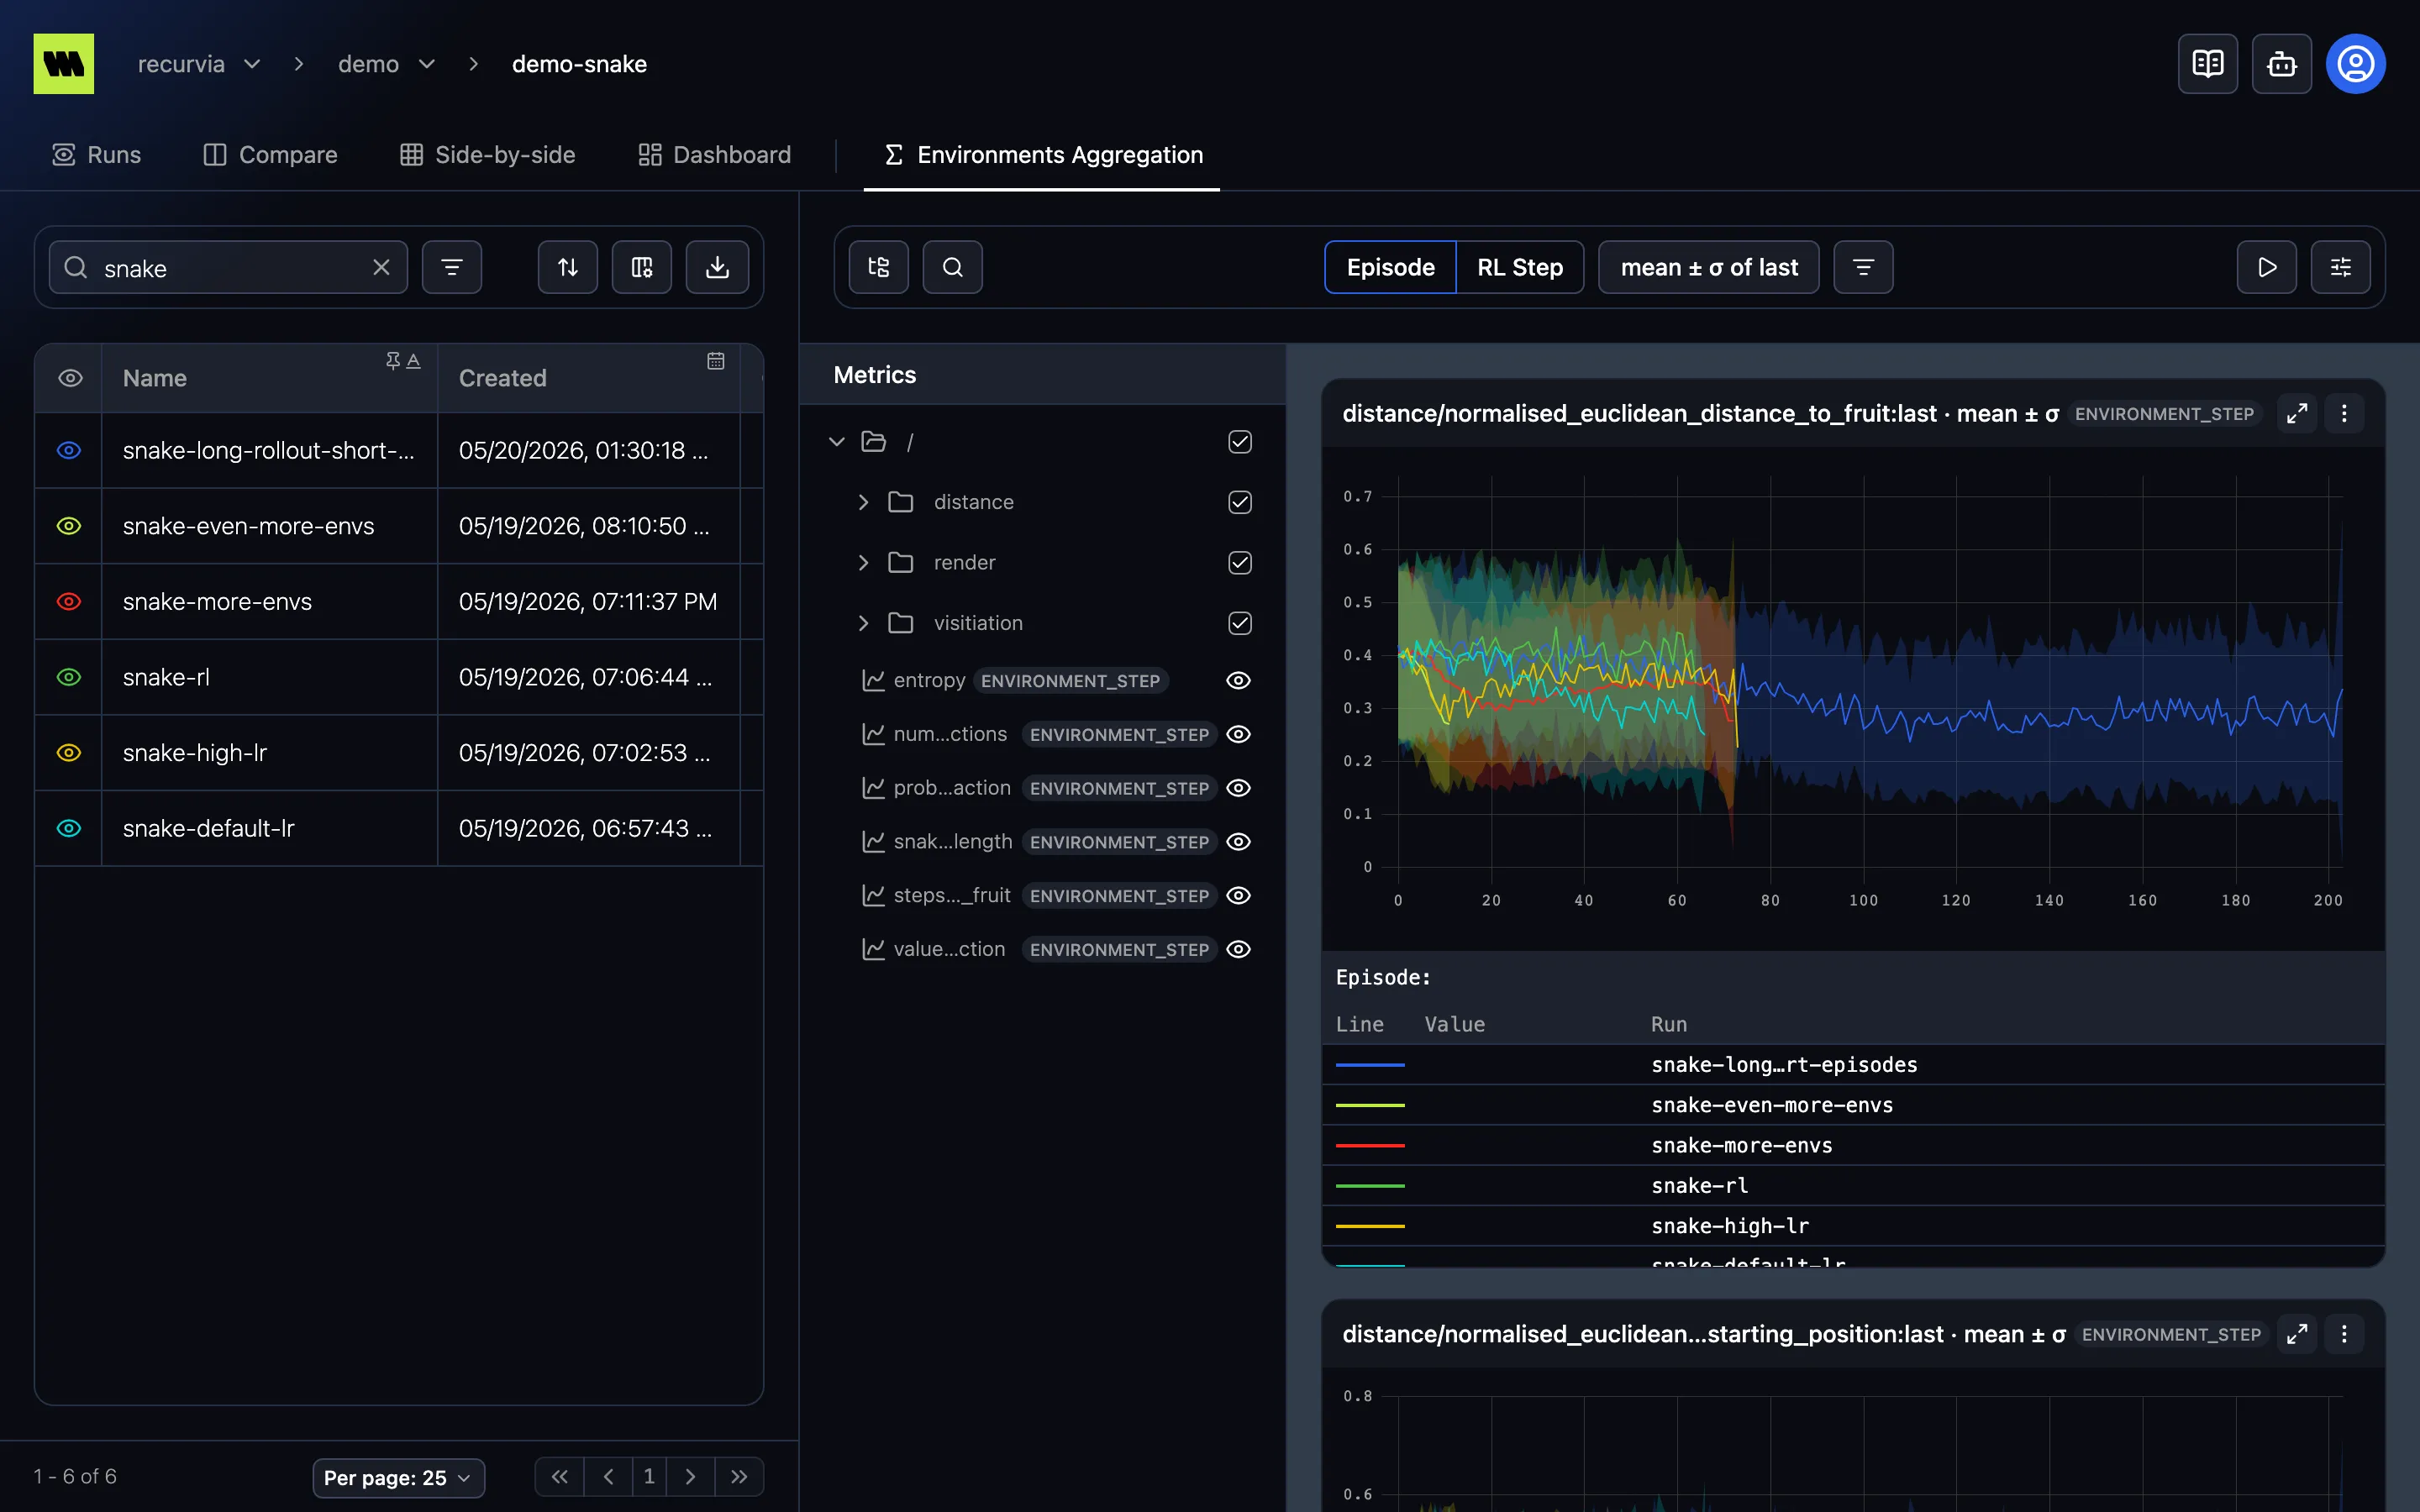
How it works
Section titled “How it works”- Runs list (left) — select runs with the eye, as for Compare. The view compares up to 10 runs; select more and it shows Too many runs selected, since aggregating every run’s environments is expensive.
- Metrics tree (middle) — the environment metrics of the selected runs.
- Charts (right) — one chart per selected metric, with a line per run, each in the run’s color.
The toolbar has:
- The Episode | RL Step toggle. As on the Aggregate tab there’s no slider: the x-axis walks the whole scale. See Episodes & steps.
- The Aggregation button — the same two settings as in Environments aggregation, within each environment and across environments, except that none isn’t offered: each run is always one line. Each chart’s ⋮ menu can override it for that metric.
- Filter environments — aggregate only some environments, picked with the shared filter controls on the Environment ID, environment attributes (such as a map or difficulty), or environment metric summaries. The filter applies to every selected run.
The scale, aggregation, and environment filter are kept in the URL.
Reading the charts
Section titled “Reading the charts”- The tooltip names each line’s Run. A run whose data is still on its way, or failed to load, is listed with Still loading or Failed to load.
- Runs with up to 1,500 points on the chosen scale are drawn exactly; longer ones are summarized to fit the chart, like long series on other charts.